Introduction to Reporting and Document generation
It is easy to enhance CUBA applications with a directly embedded comprehensive report / document generation capability. The CUBA Reporting add-on supports various file formats like DOCX, XLSX, PDF, HTML for templating as well as output file formats. Furthermore, it has management screens and provides APIs to interact with the report / document generation process programmatically.
In this guide we’ll tell you about the Reporting add-on and how to interact with it through the UI and programmatically.
What we are going to build
This guide enhances the CUBA Petclinic example to show how to embed the reporting capabilities into the application:
-
an ability to download a
patient-recordword document with all relevant information (master data, visit data) for a given pet through the details screen of the pet. -
a
recent-visitsreport downloaded from the visit browse screen. The report contains visits of the last month, exported as an Excel sheet with information about the visit, the referenced pet and its owner.
Requirements
Your development environment requires to contain the following:
-
CUBA Studio as standalone IDE or as an IntelliJ IDEA plugin
Download and unzip the source repository for this guide, or clone it using git:
Example: CUBA petclinic
The project that is the basis for this example is CUBA Petclinic. It is based on the commonly known Spring Petclinic. The CUBA Petclinic application deals with the domain of a Pet clinic and the associated business workflows to manage a pet clinic.
The underlying domain model for the application looks like this:
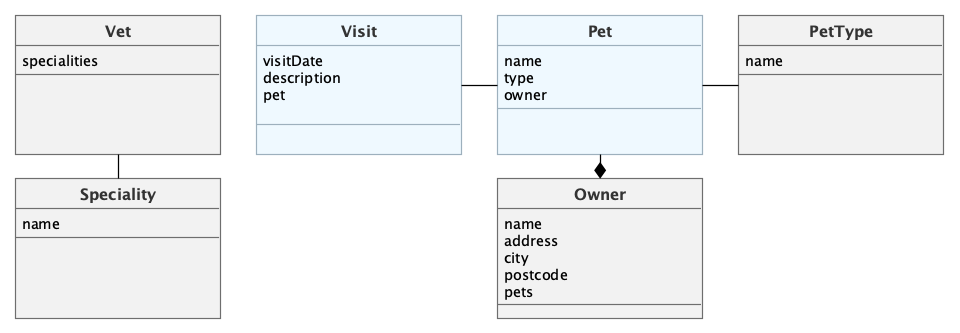
The main entities are Pet and Visit. A Pet is visiting the petclinic and during this Visit a Vet is taking care of it. A Pet belongs to an Owner, which can hold multiple pets. The visit describes the act of a pet visiting the clinic with the help of its owner.
Overview
Oftentimes when working with business applications there is a high demand for document generation, that will take some information from the source application and bring it in the form of a commonly known format, so that you can share it with other parties like customers, partners or other systems.
These documents might either have the form of human consumable content like a PDF file or are used more as input data for further use like a CSV / Excel file or a Word document.
CUBA, being targeted towards the needs of business applications, in particular has dedicated support for this kind of use cases through the Reporting add-on.
It has the ability to define formatted document templates and declare the data that should be used for the document. This definition is done in a declarative way, that does not require writing any code in order to generate reports / documents. It is possible for developers as well as administrators and business users with mid-level technical skills.
Example Use Cases
As it was mentioned above, there are lots of use cases that deal with generating documents / reports out of a source application. Here’s a list of examples:
-
create an Excel sheet of the TOP 10 customers with the highest total turnovers
-
generate an invoice for an order stored in the application in PDF format
-
create payment data file as a CSV file for file exchange between the payment system and the BI system
-
show a list of best sold products aggregated by category as an application screen
-
create an HTML file of the latest sales offers in order to upload & publish this file on a website
The Reporting add-on can handle all of those requirements and more. In the next section we’ll cover the overall concepts and describe how the use cases are implemented.
Templates + Data = Document
The underpinning of this whole solution is based on the combination of document templates with data, that are merged to create the resulting document / report.
The Document Template
The document template is a file that acts as a blueprint for how the target file should look like. It contains placeholders as particular text snippets, that the Reporting add-on can pick up and put the data into the document.
Those placeholders can be inserted as regular text into the template file, but they need a special character to indicate that this text is a placeholder. A placeholder is defined in the following way: ${NAME_OF_PLACEHOLDER}
Below you can see an example of a document template. It’s an Excel sheet, which will be used further in this guide:
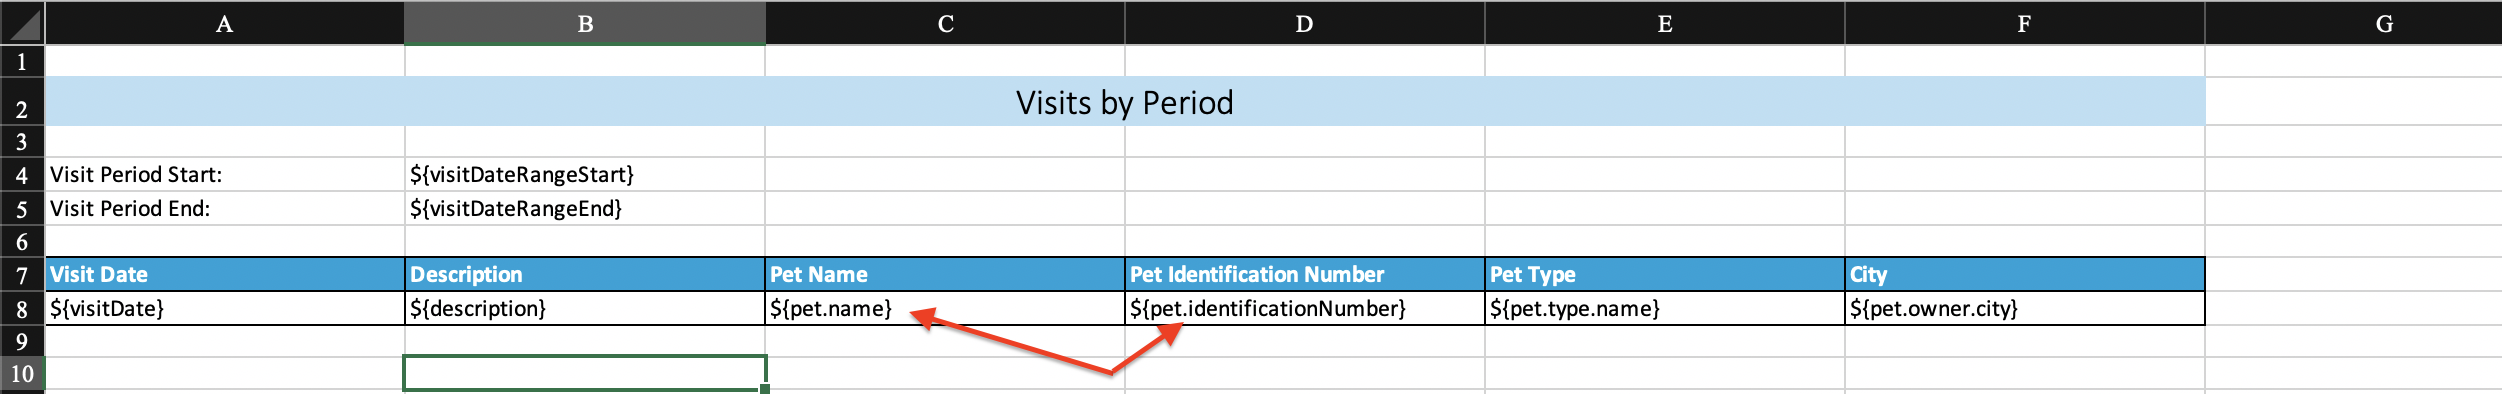
The template contains regular text as well as the placeholders for different columns in a table like ${pet.name} or ${pet.identificationNumber}.
Furthermore, you can style and adjust the document template in any desired way. For Word and Excel documents you can apply all the possible formatting options of those programs. For HTML documents you can use the complete capabilities of CSS for styling the target document.
| The template file format is not necessarily the file format of the output document. It is possible to e.g. have a Word based document template that will generate a PDF file when merged with the data. |
Data Sources
The data used for the report can be of various sources. Within a CUBA application fetching the data directly from the entity layer of the application is the most convenient variant. However, the Reporting add-on is not bound to this particular data source. It can use one of the following data sources:
-
CUBA Entities / JPQL
-
SQL
-
Groovy
-
JSON
These various sources provide a high degree of flexibility when it comes to fetch data and provide it to the template file. You can also define multiple data sources and combine all the data in the template.
Report Configuration
Once the data sources are defined and connected to particular template placeholders through a concept called Bands, everything is setup to generate the output document. The add-on stores all this configuration in the Report entity which holds the configuration of the data sources and the definition of the templates and further configuration information.
There are two main ways to create those report records.
The first one is to create a report manually and define the data sources with the associated JPQL / SQL queries / Groovy scripts.
This is usually necessary for defining complex reports and requires skills to create SQL / JPQL statements or program Groovy scripts. This option is mostly for administrators that have a deep technical understanding of the inner application processes and domain model, as well as understanding of the Reporting add-on technical concepts like report bands, report parameters etc.
The Report Wizard
The second option is to use the report UI wizard that guides a user through various options. It includes the ability to define the conditions for entities to be selected for the report, the attributes that should be included. Furthermore, it generates a base template which already contains the selected attributes as placeholders.
This variant is mostly for business users, since it hides away the technical details of things like the query definition behind a user-friendly configuration UI. For easier reports, this wizard can serve as the main UI for creating reports by business users directly.
Generating a document template with the correct placeholders of the selected attributes allows business users to change only formatting of the output document. The template formatting is normally performed in the application that they are already familiar with like Word or Excel. The main difference is that this opens up possibilities for non-technical people to work with reports with no need of any developer help.
With that, for tech-savvy people it is usually the fastest way to create a report or at least a starting point for manual adjustments.
One constraint for the report wizard is that it is tied to generating reports / documents based on the CUBA entity layer. You can’t directly create Groovy / SQL based reports through the wizard. However, it is possible to use the wizard report as a first step and then adjust the resulting reports bands accordingly through the regular management screen.
External Parameters
A Report configuration can declare external parameters that are provided by the person or application code interacting with the report. Those parameters are mainly used for the data fetching parts. In the JPQL / SQL statements as well as the groovy based data bands, those parameters are passed in to dynamically inject the values into the query / the groovy script.
The configuration of the external parameters in the Reports configuration screen looks like this:
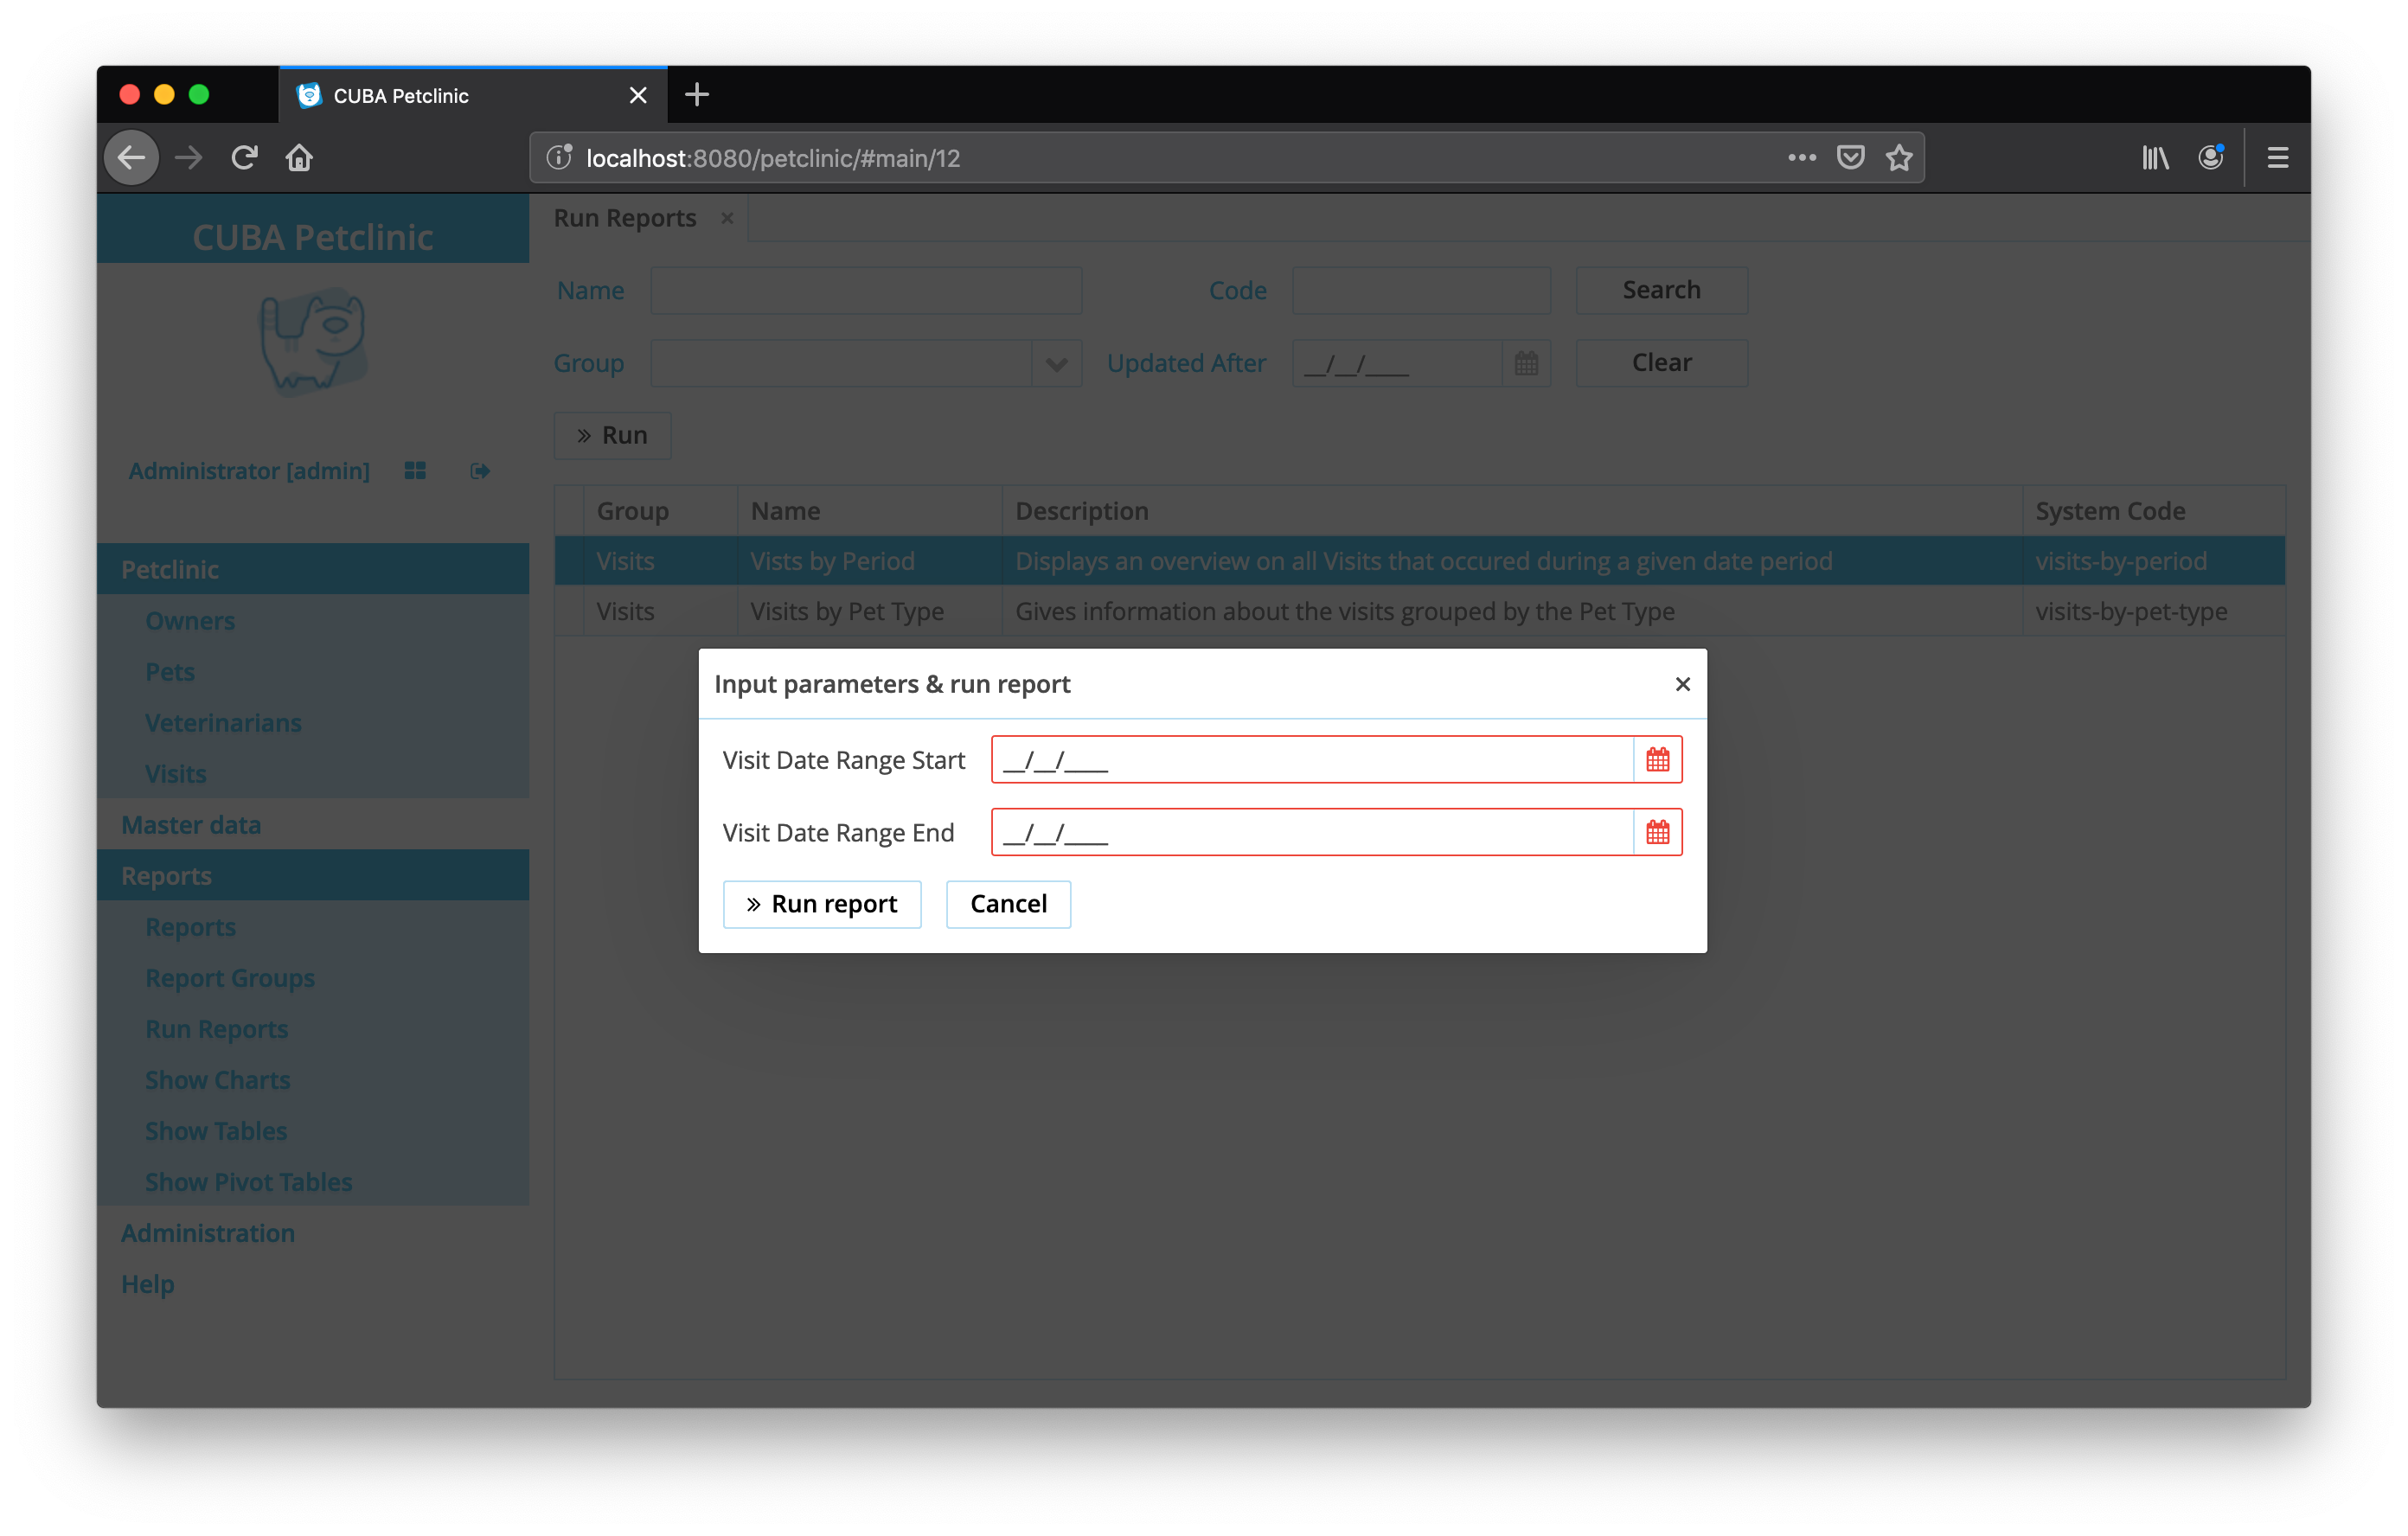
When external parameters are defined, the values can be entered in two ways. The first way is to expose these parameters as a form in the generic UI. It will appear at the report execution time through the generic Reports execution UI. Here is an example of such a UI:
Patient Record
First we will learn how to generate a report with patient records for a given pet. It contains an overview of the pet’s master data and visit data for that pet.
In this case the document template will be a Word document. However, the target document will be a PDF file.
The report will have the following default settings:
-
Report Entity:
Pet (petclinic_Pet) -
Template Type:
DOCX -
Report Name:
Patient Record -
Report Type:
Report for single entity
the templates of the reports can be found in the demo project under examples/records. You can import the *.zip report configuration through the Report Browse screen.
|
Defining the Attributes
The direct master data of the pet is similar to the one selected in the recent-visits report, basically the data of the Pet entity and the associated Owner entity. Those attributes are configured in a so-called "simple region". Examples for attributes within a simple region in this case is something like Pet.name, Pet.identificationNumber but also attributes from one-to-one or many-to-one associations like Pet.owner.firstName.
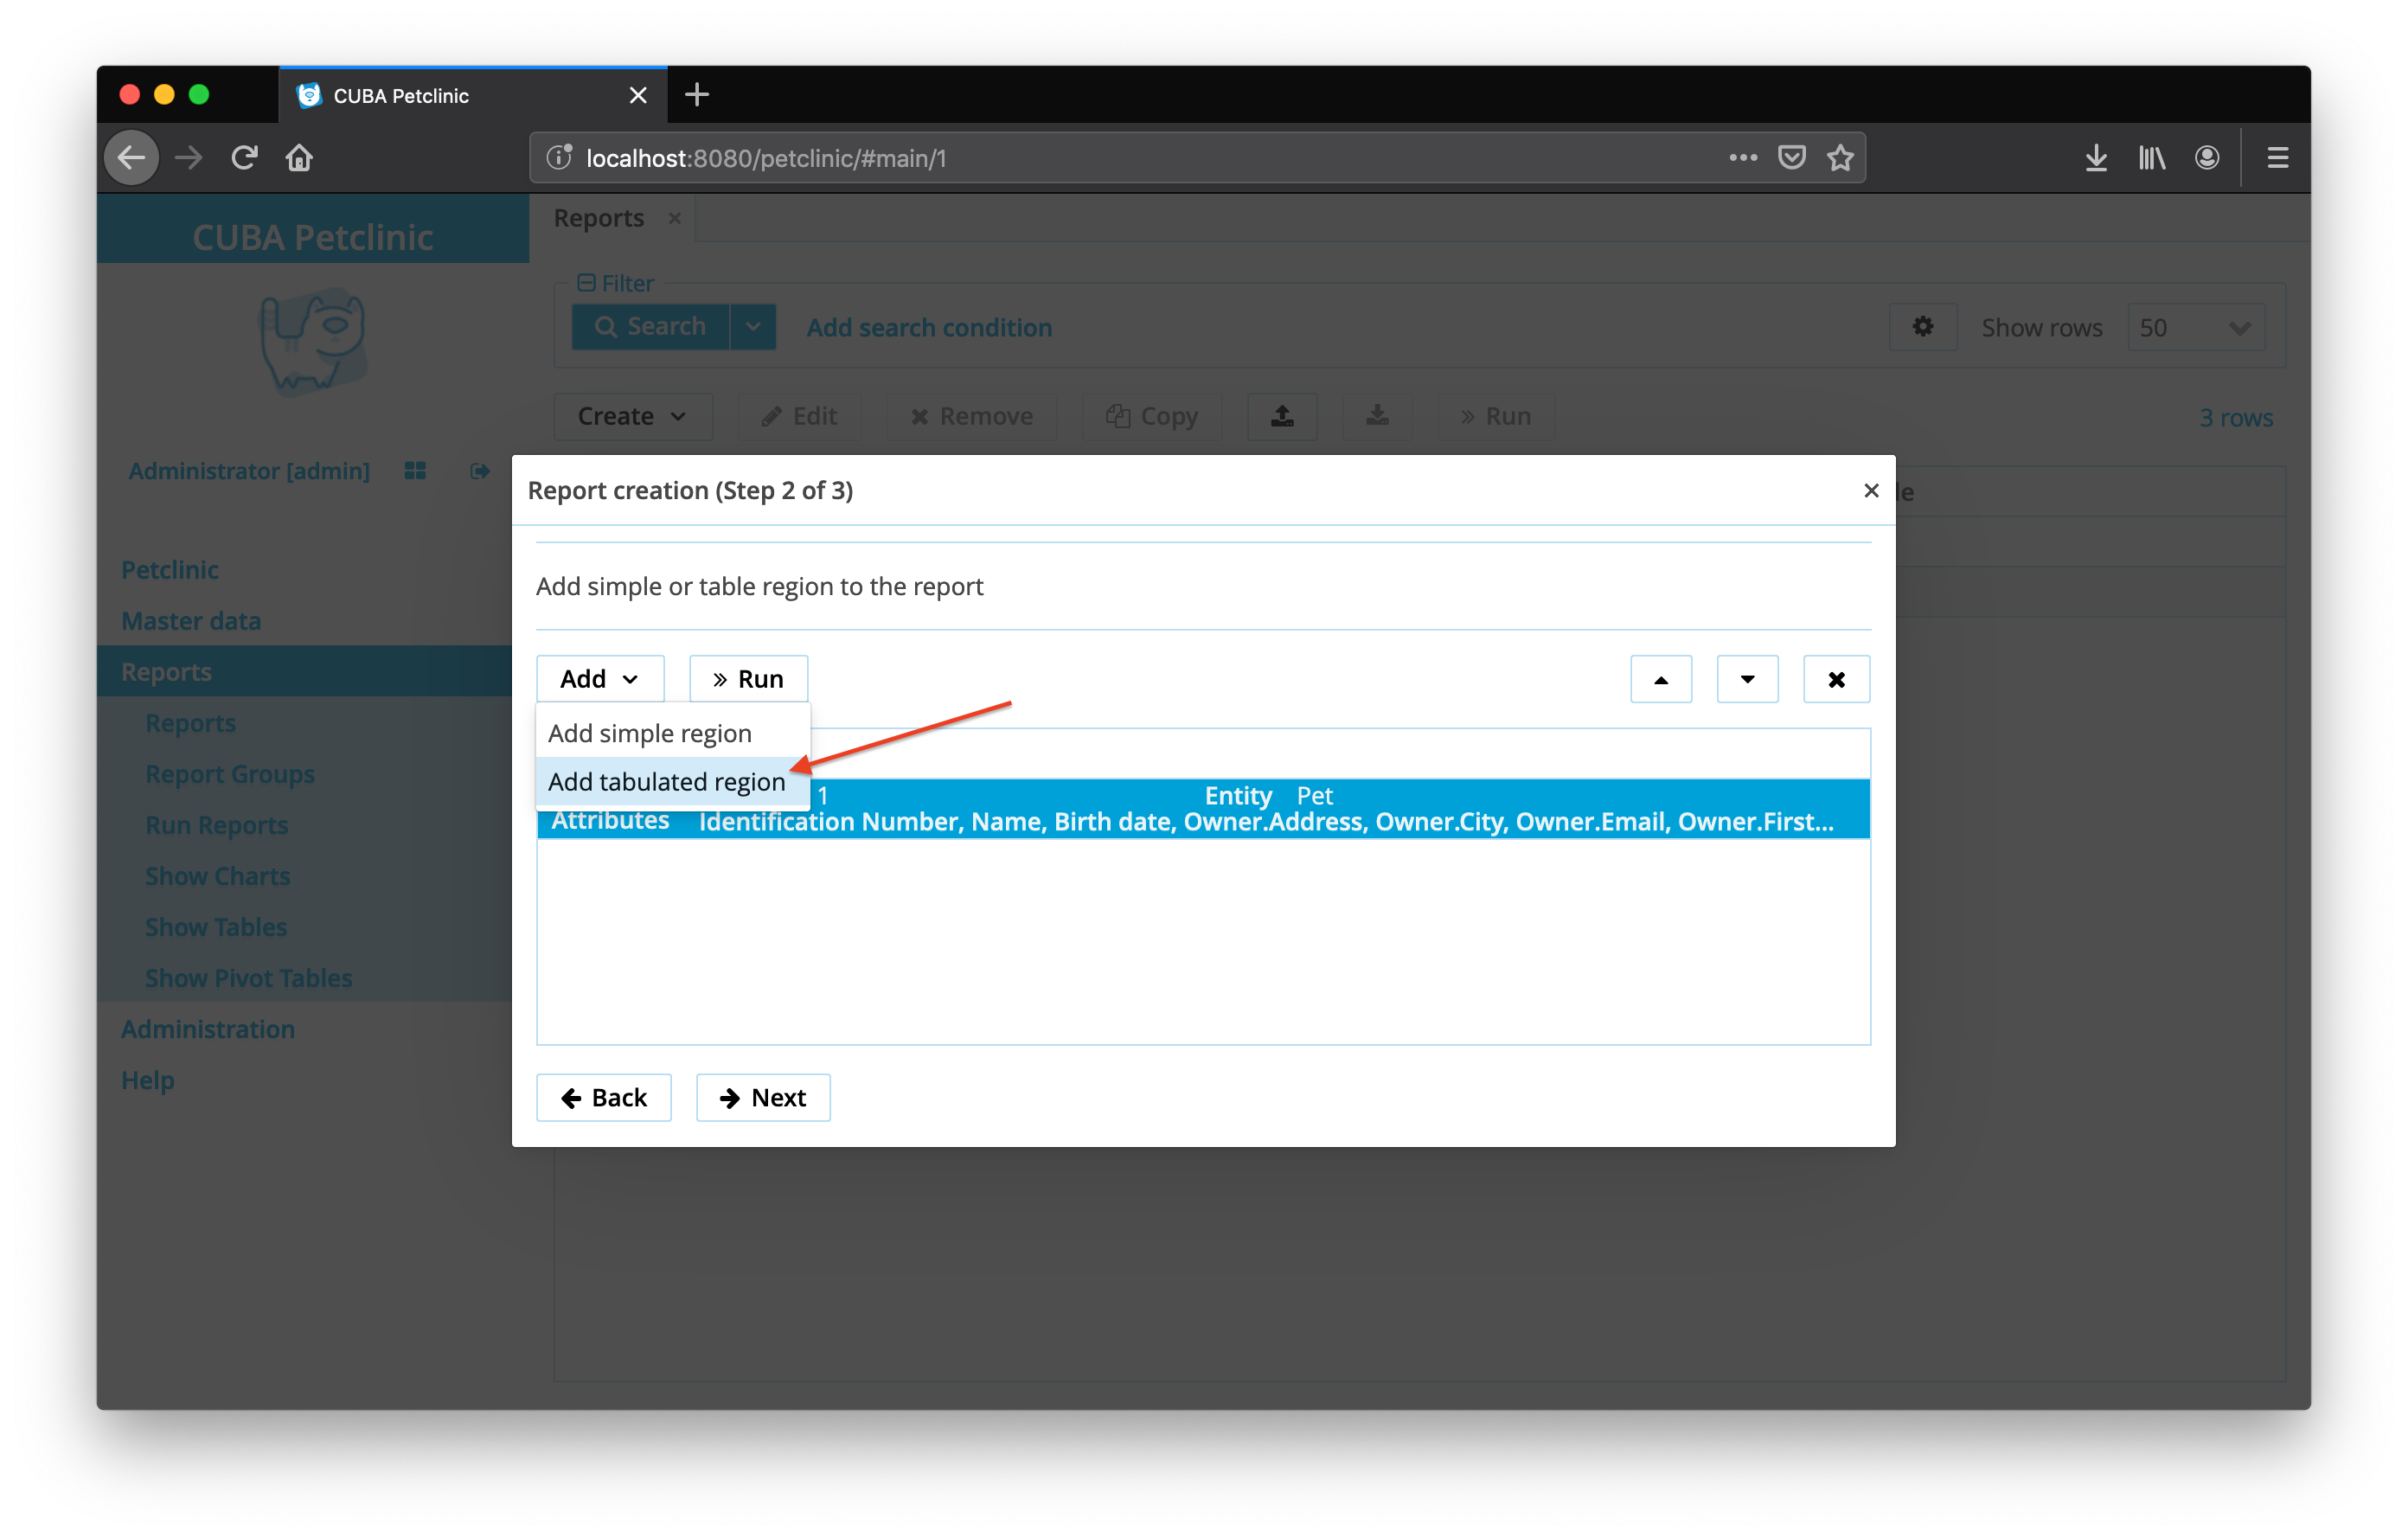
To display a list of associated visits of this Pet entity, we’ll create another data band. This is possible during the initial Reporting wizard. Those associations (one-to-many or many-to-many) are configured in "tabulated region" in the Report Wizard.
In the second step after initially defining the direct attributes of the entity, we can create additional "regions" in the report. Those regions are basically translated to a particular data bands generated out of those selections.
Configuring the Output document
The output document for this report contains one template defined initially through the report wizard. So, the corresponding section in the Report Configuration screen contains one template entry.
The output type is set to PDF while the template file is DOCX.
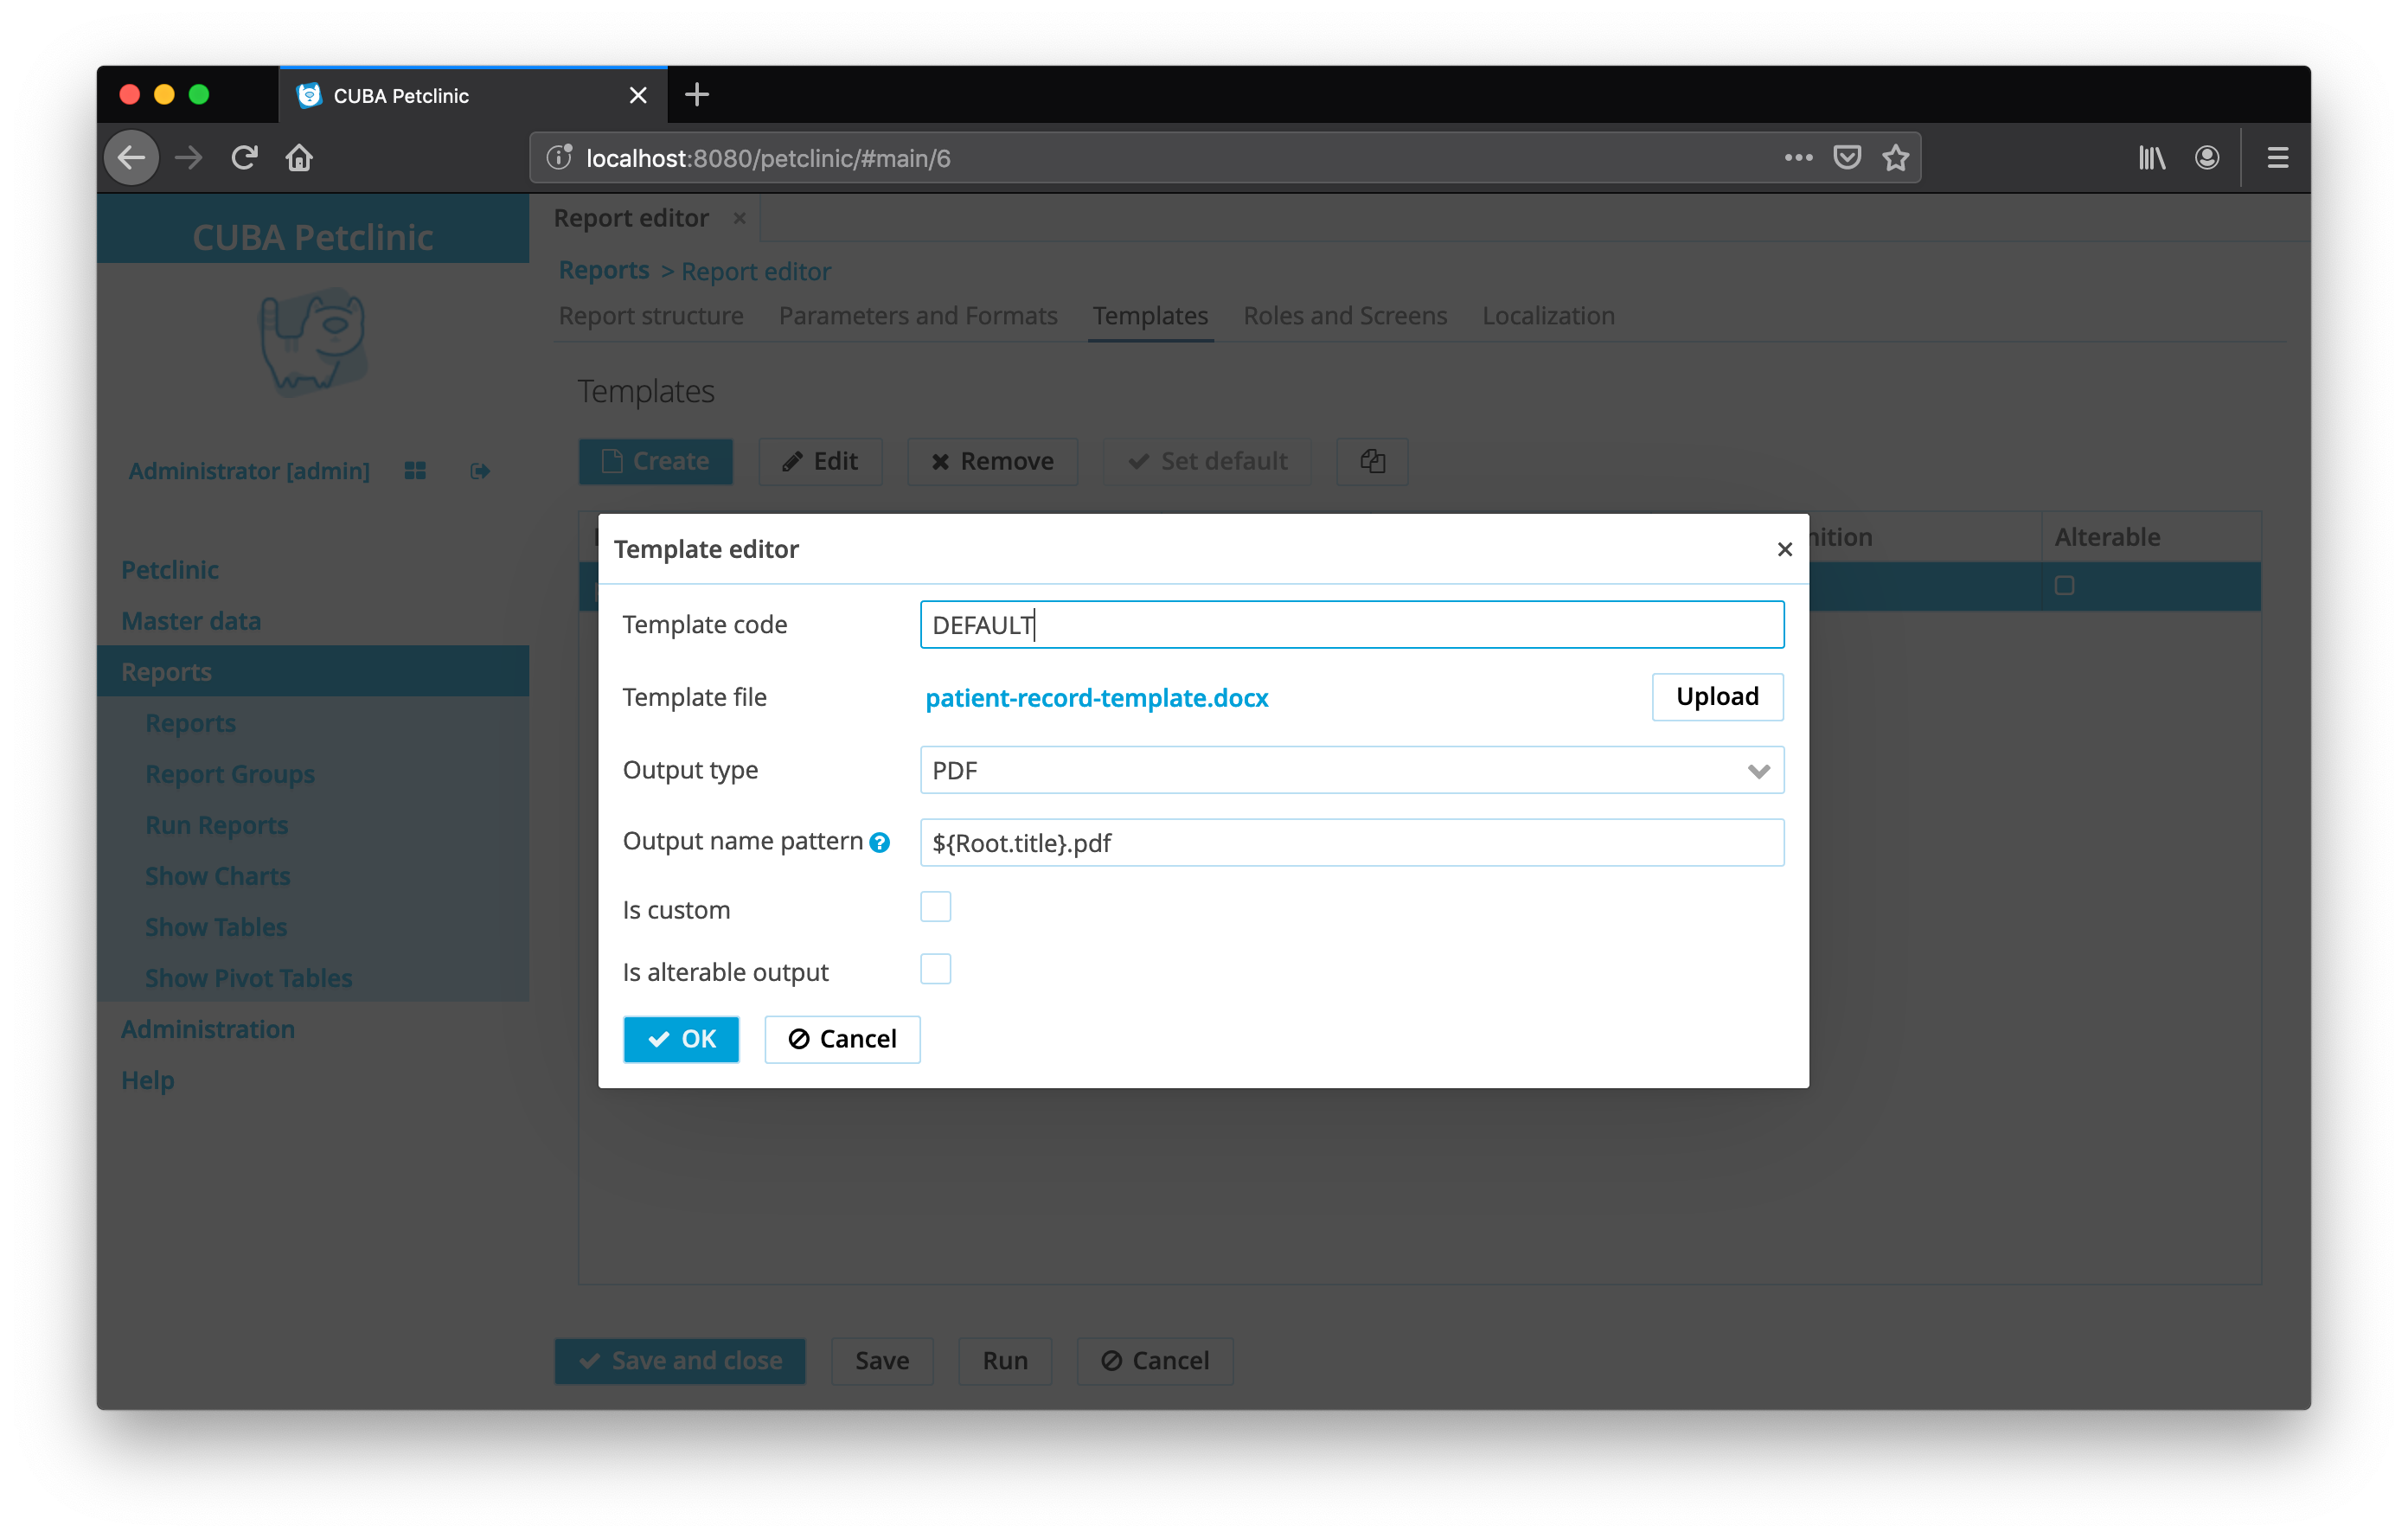
Additionally, it is possible to define the filename of the output document. This can either be a static filename or it can be programmatically configured.
In this case, the filename should look like this for the Pet with the name "Horsea": Patient Record - Horsea.pdf.
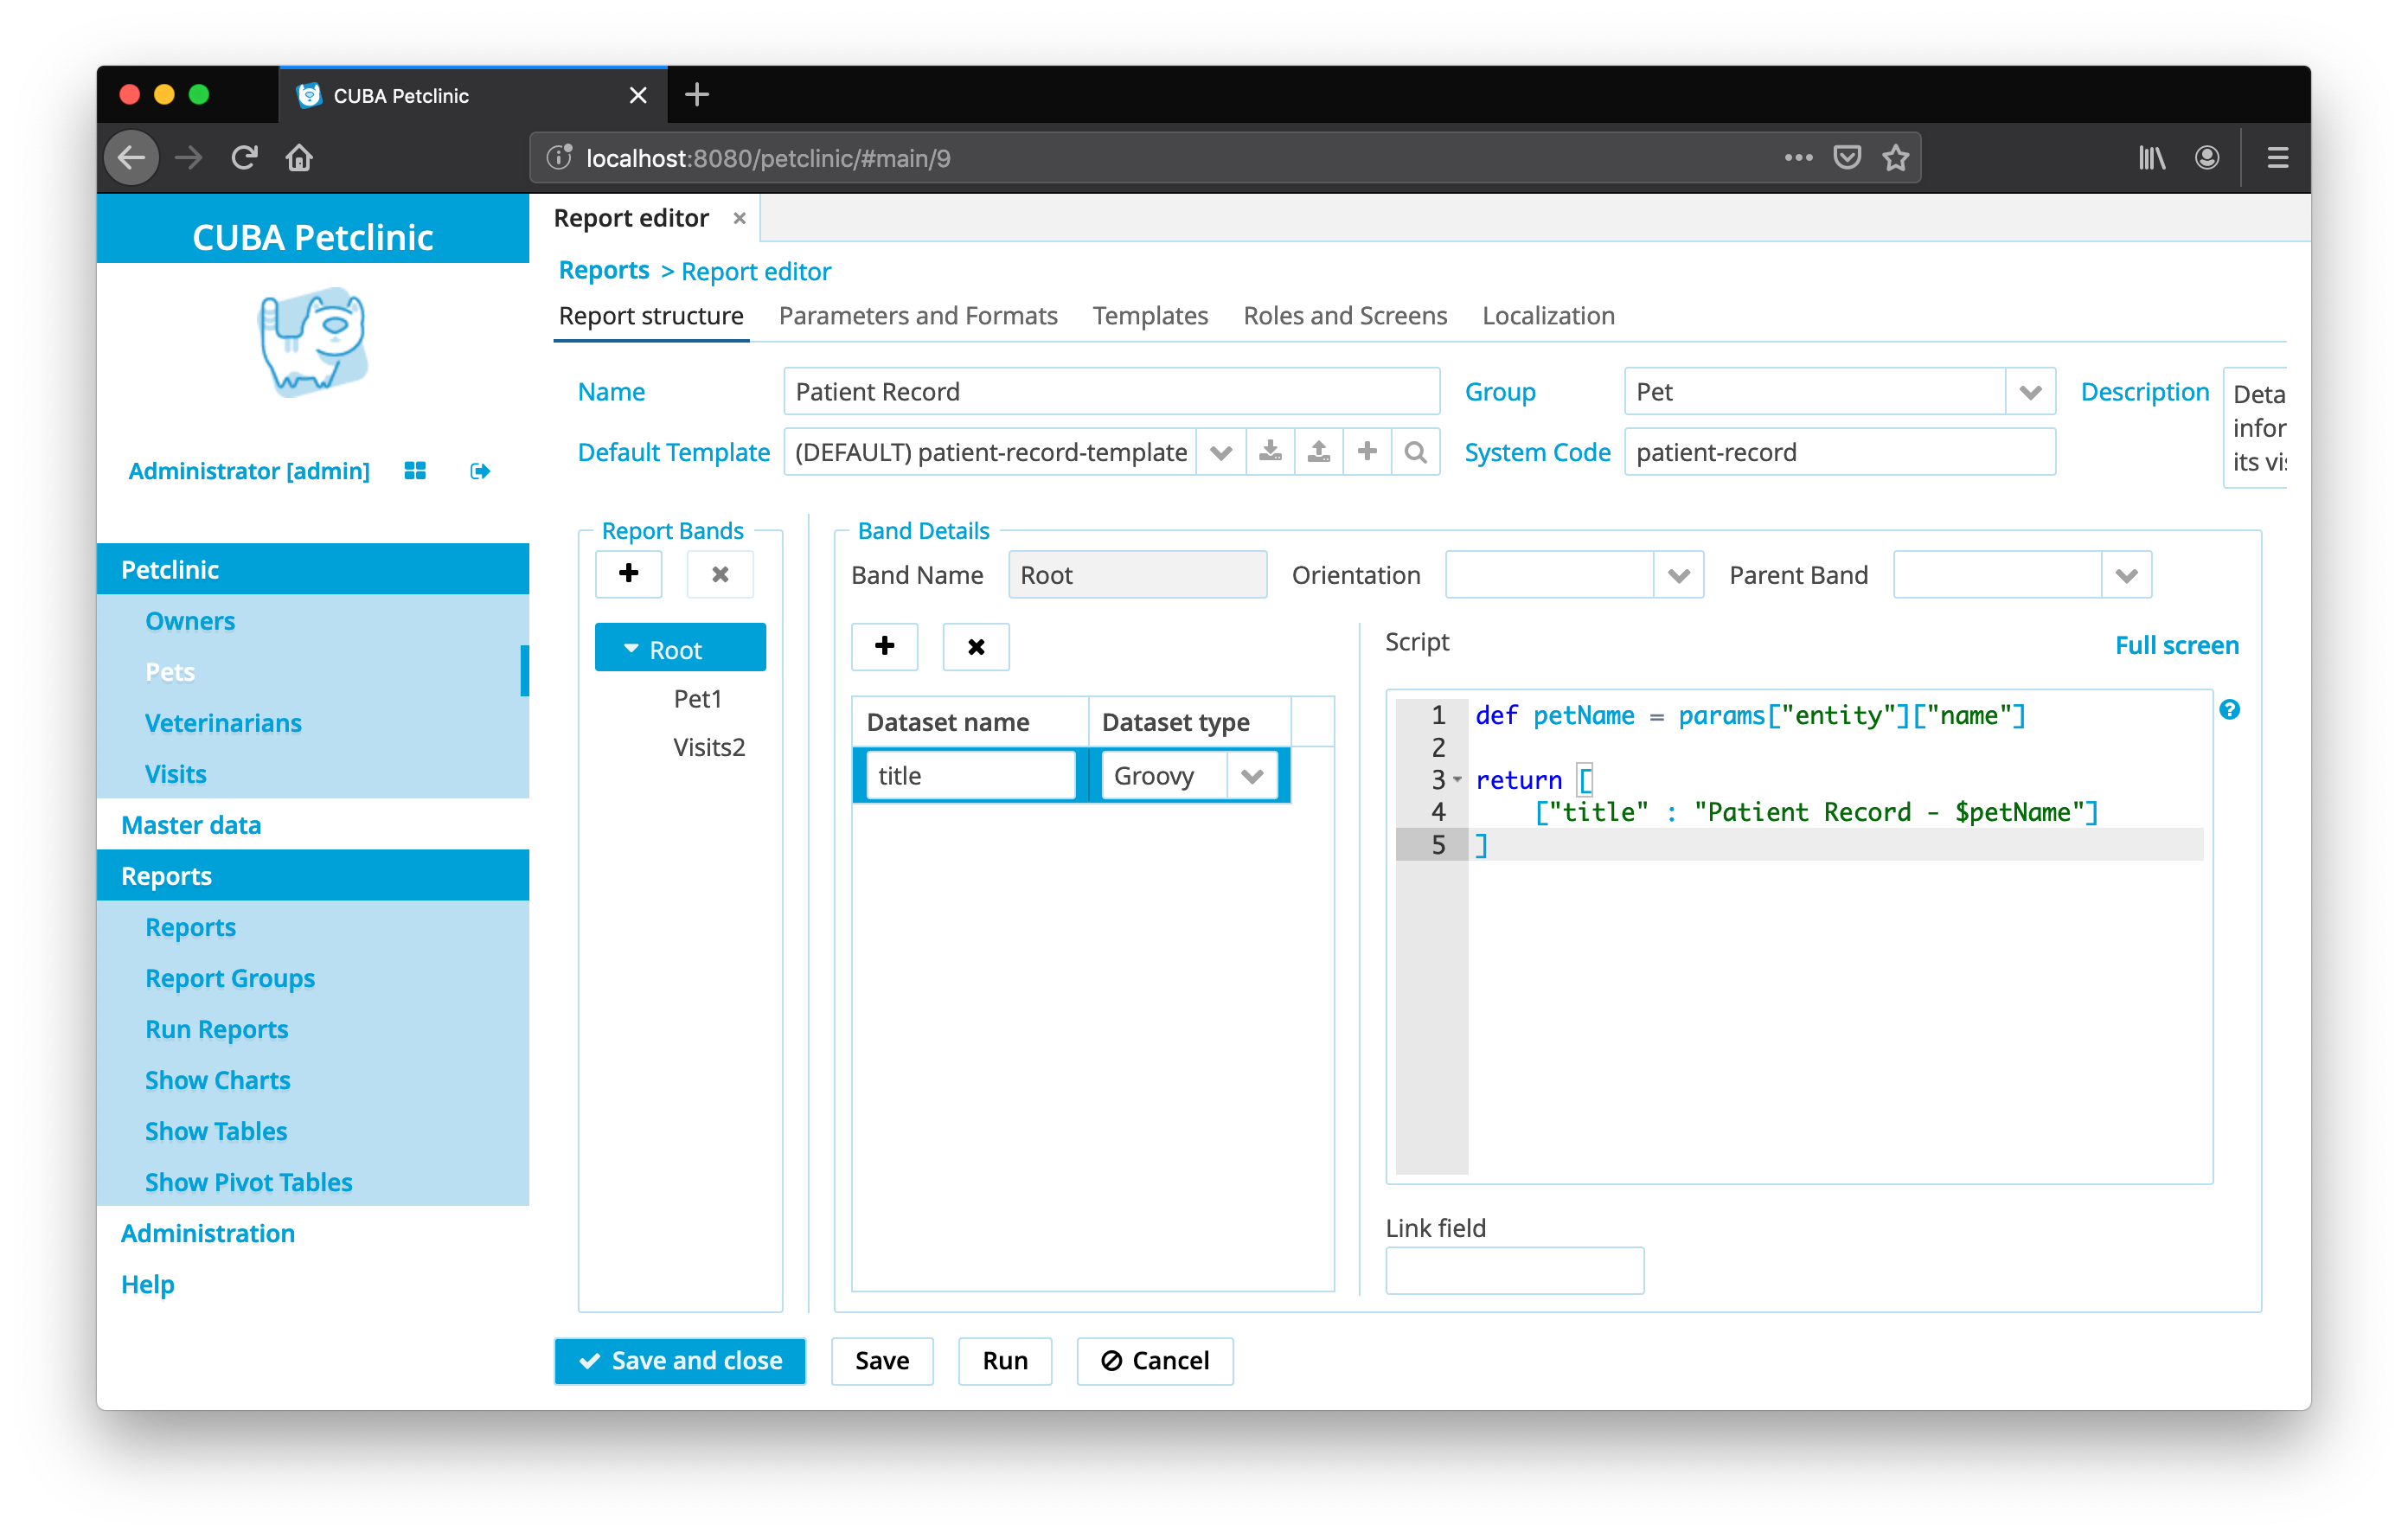
To achieve this, we can configure a pattern which references a particular band: ${Root.title}.pdf
Root.title refers to the title value of the Root data band. A groovy based data set will define the value for the title attribute like this:
def petName = params["entity"]["name"] (1)

return [
    ["title" : "Patient Record - $petName"] (2)
]| 1 | the params variable gives access to different external parameters. params["entity"] refers to the selected pet instance. |
| 2 | a List of Maps has to be returned from this groovy script. Under the key title it will put the target filename |
The resulting usage of the groovy based data set looks like this:
LibreOffice for accurate Word to PDF conversion
After configuring the output document to be PDF, we need to make several adjustments in the application configuration. To increase the accuracy of the PDF output document, CUBA can leverage the conversion facilities of LibreOffice.
LibreOffice has an API that other programs can use to convert different file formats (especially PDF file generation). The Reporting add-on uses this API when LibreOffice is installed on the operating system and configured in the CUBA application properties.
reporting.openoffice.docx.useOfficeForDocumentConversion = true

## Unix:
# reporting.openoffice.path = /usr/lib/libreoffice/program

## Windows:
# reporting.openoffice.path = C:/Program Files (x86)/LibreOffice 5/program

## MacOS:
reporting.openoffice.path = /Applications/LibreOffice.app/Contents/MacOS
We need to activate the usage of LibreOffice and configure to CUBA the path to the LibreOffice binary. Once this configuration is done, the CUBA application can render PDF files from DOCX and XSLX templates.
Find more information on the configuration in the official Reporting docs: Appendix A: Installing and Configuring OpenOffice.
Running the Report from the Pet Detail Screen
There are two variants of how to run a report programmatically from a screen.
In the first variant, the report configuration determines in which screens it should be "available". The remaining code in the controller just declares that it wants to print a report, and the Reporting add-on will then figures out which reports are possible in this context.
The corresponding configuration section in the Reporting is "Roles and Screens". Within this section we can configure a list of UI screens where the report is available.
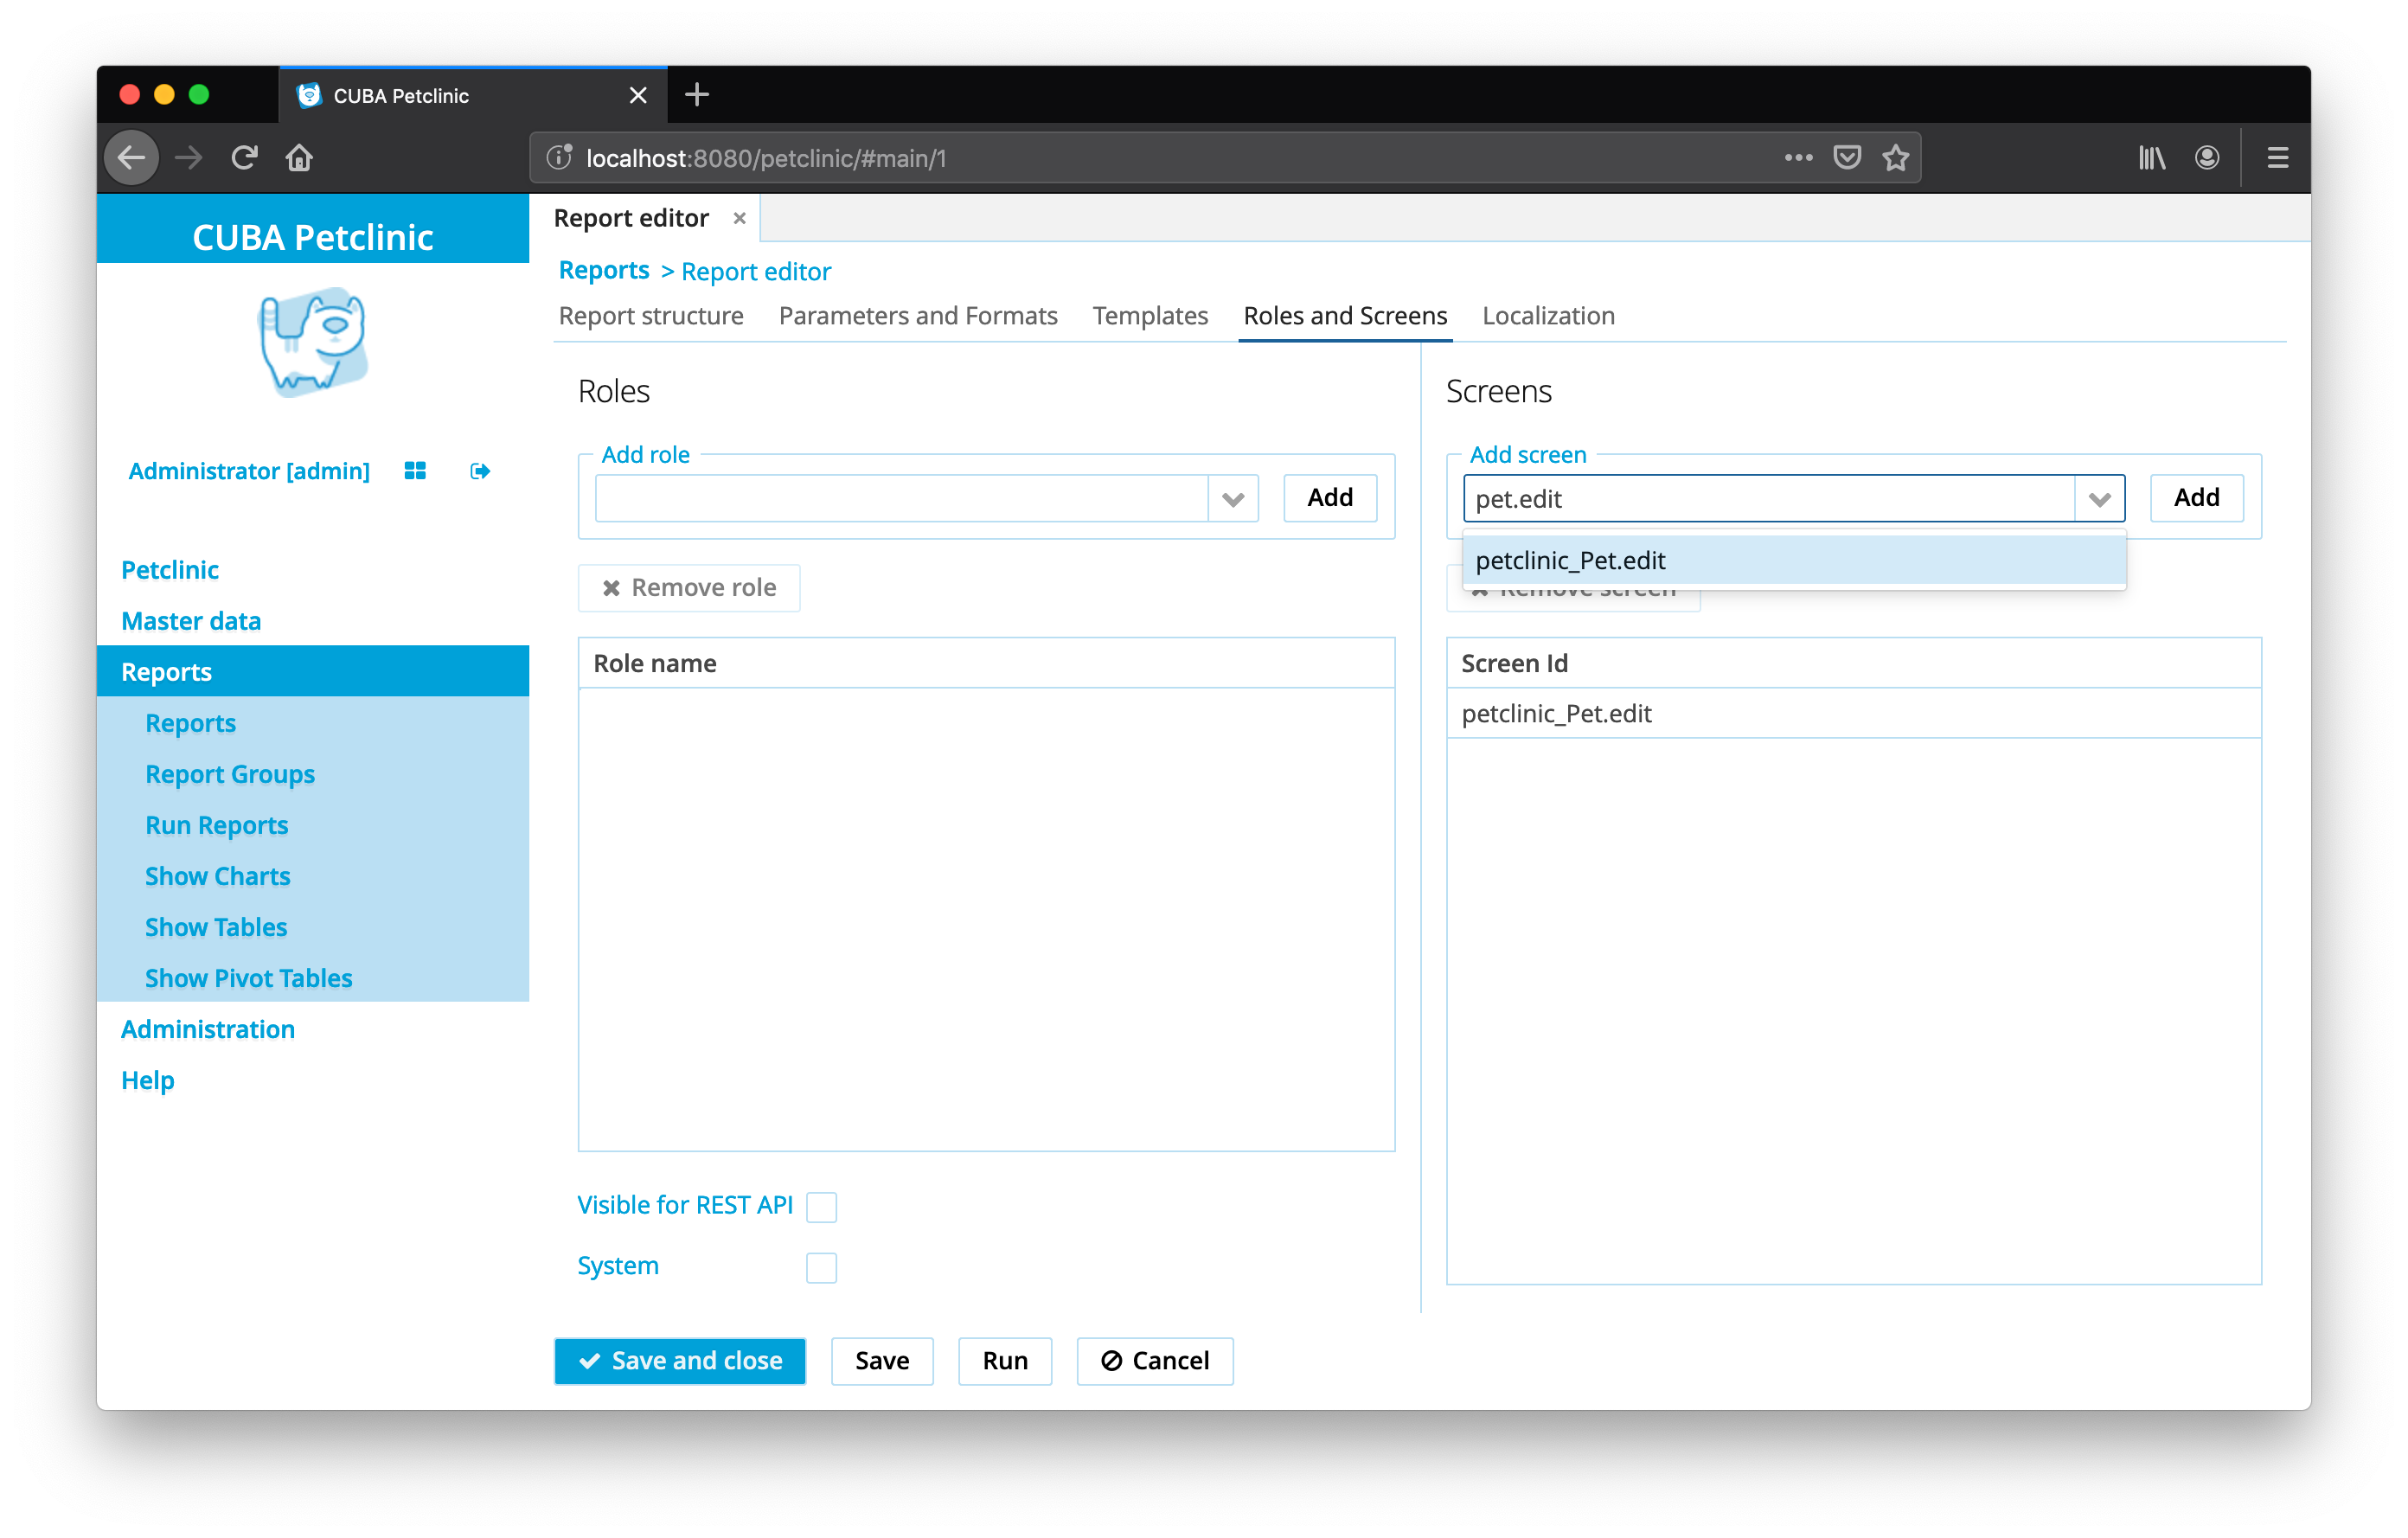
The screen petclinic_Pet.edit is added to the list of screens on the right side of the configuration interface.
In the target UI screen, the following code is added in order to trigger the report execution.
<hbox id="editActions" spacing="true">
    <button action="windowCommitAndClose"/>
    <button action="windowClose"/>
    <button id="patientRecordBtn"
            caption="msg://patientRecord"/> (1)
</hbox>| 1 | a new patientRecordBtn is placed next to the default save & close buttons |
import com.haulmont.reports.gui.actions.EditorPrintFormAction;

@UiController("petclinic_Pet.edit")
public class PetEdit extends StandardEditor<Pet> {

    @Inject
    protected Button patientRecordBtn;

    @Subscribe
    protected void onInit(InitEvent event) {
        patientRecordBtn.setAction( (1)
                new EditorPrintFormAction(this, null) (2)
        );
    }

}| 1 | the action is configured at the init event of the edit screen |
| 2 | the EditorPrintFormAction from the Reporting add-on is used, which automatically searches for reports configured in this screen |
In case multiple reports are configured as available, the user is prompted with a pop-up to select the correct report to run. In this case, there is only one report configured for this screen, which results in automatic execution of that report without any further required interaction with the user.
Recent Visits Report
The second example generated by the application is the recent-visits report. It should be accessible as a download directly from the visit browse screen. The report contains visits for the last month, exported as an Excel sheet with information about the visit, the referenced pet and its owner.
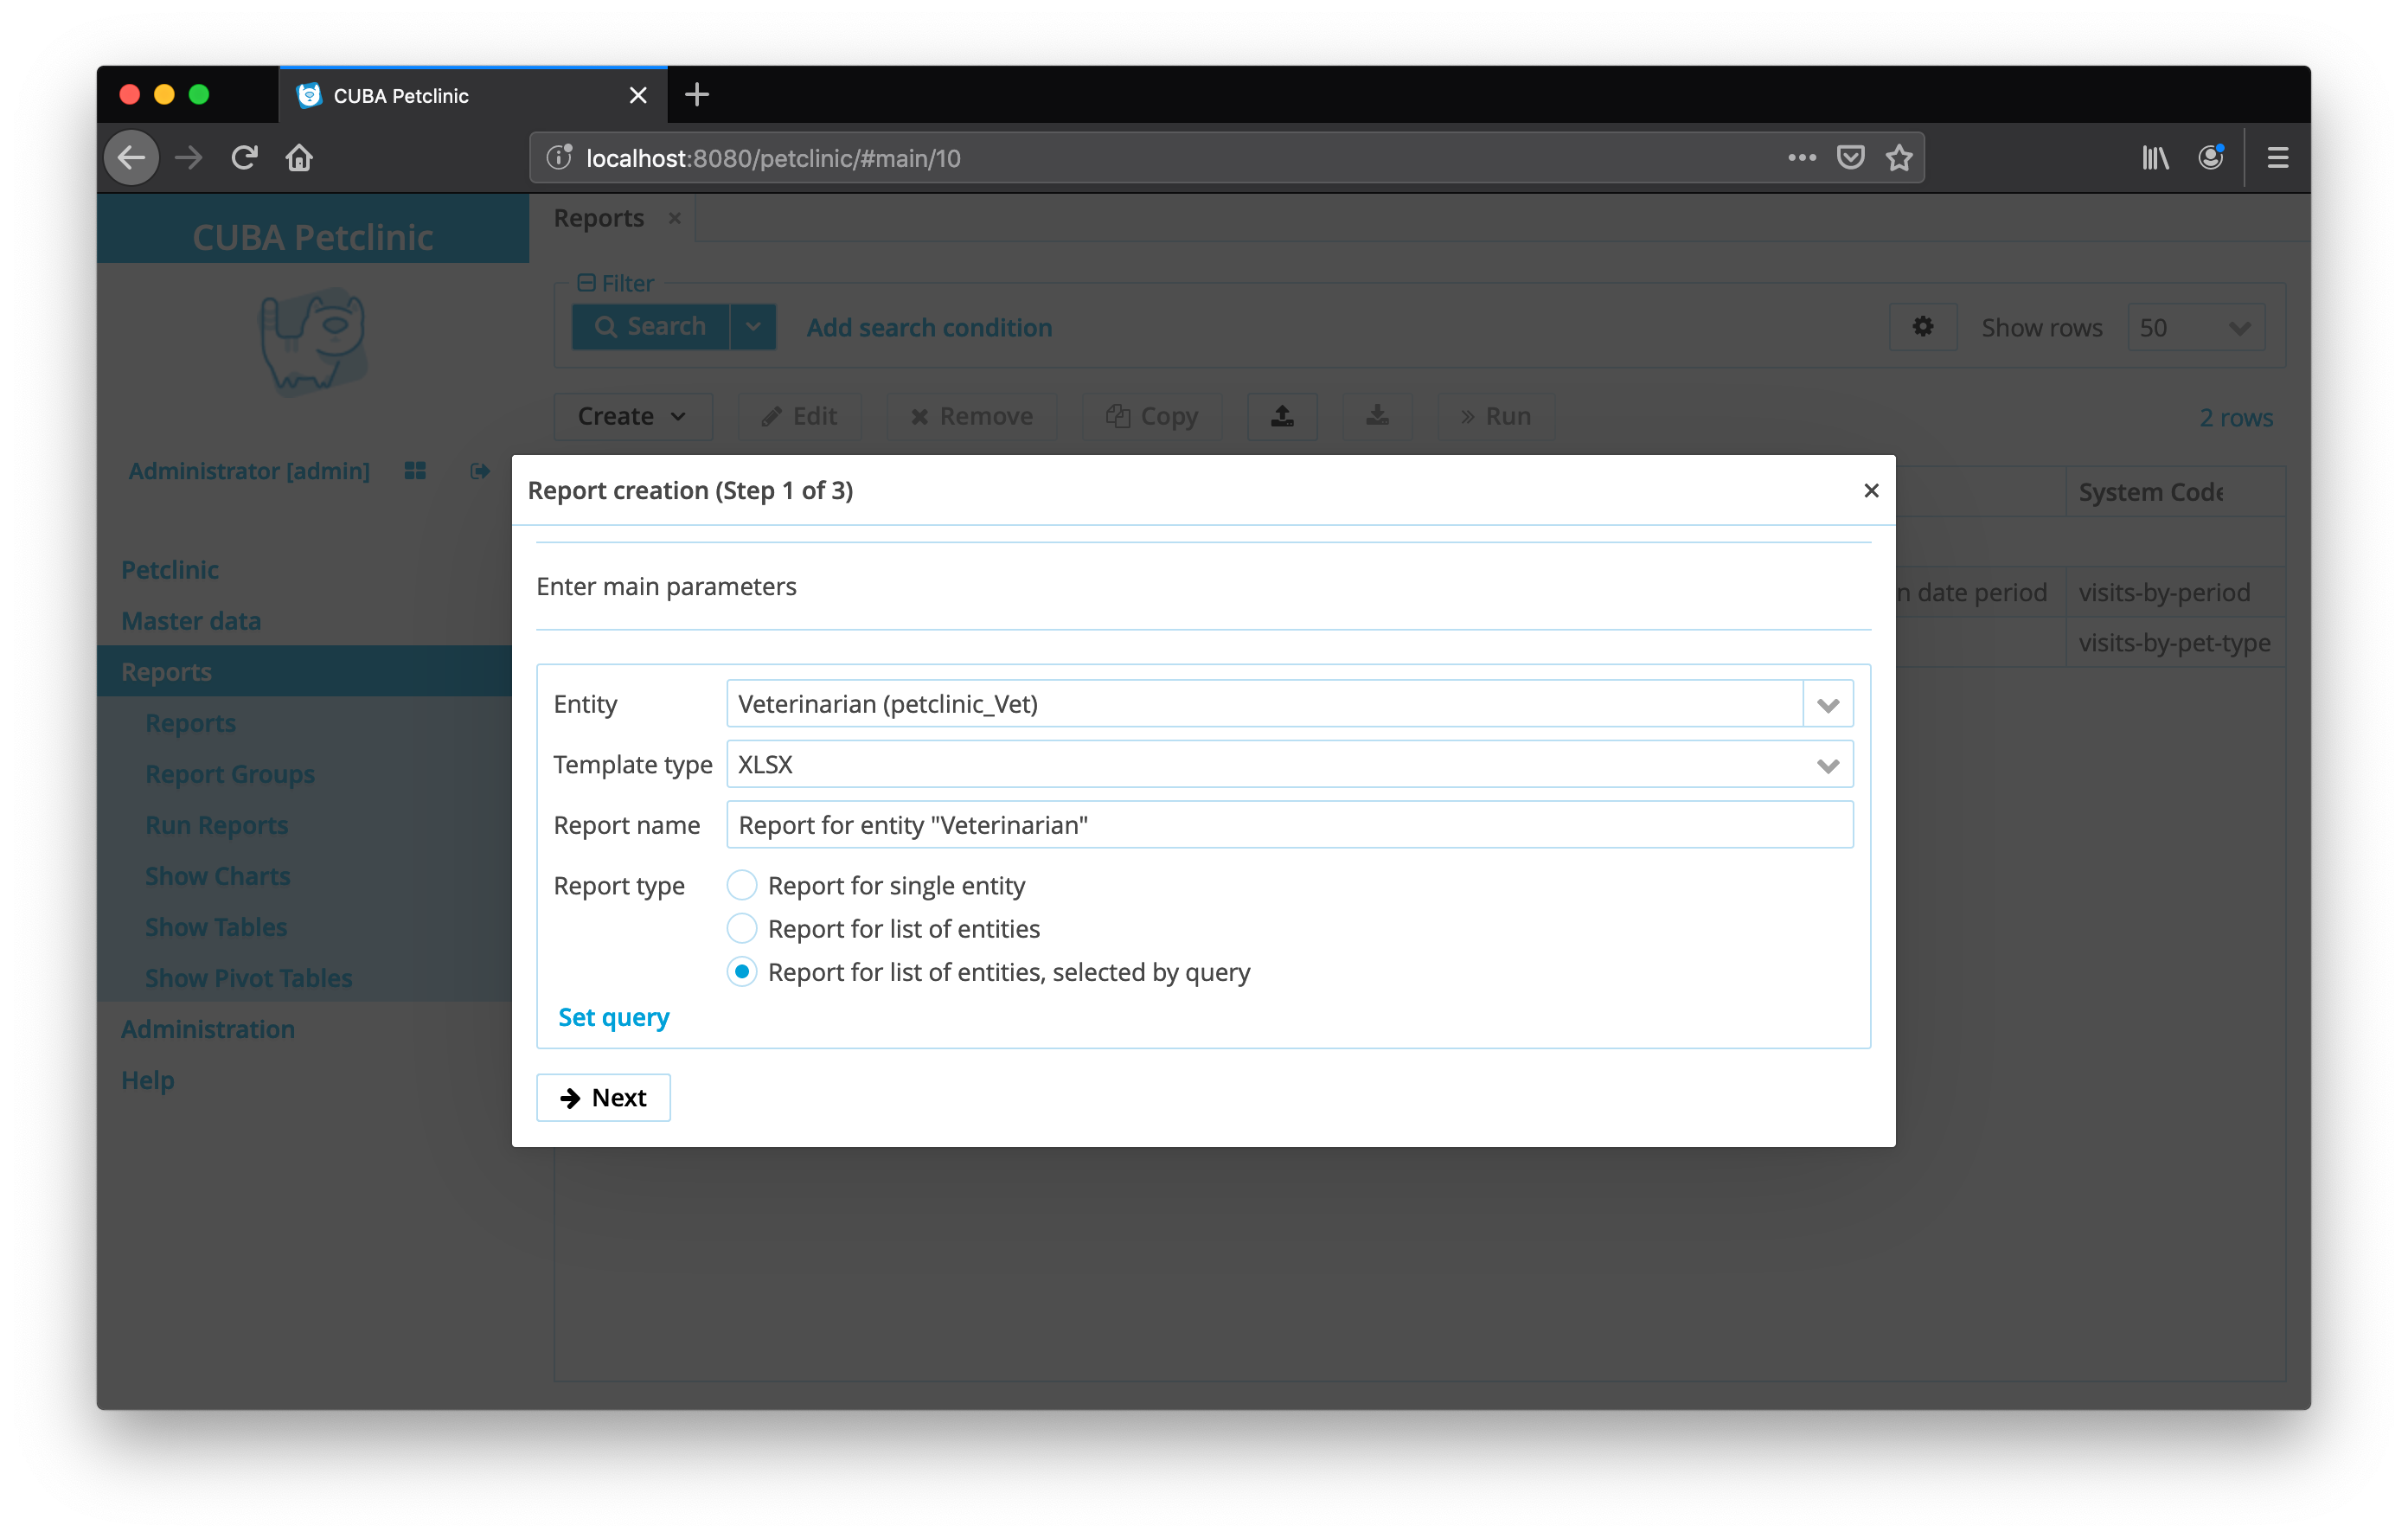
To meet this requirement, the first step is to create a report via the Report Wizard. The following main settings are:
-
Report Entity:
Visit (petclinic_Visit) -
Template Type:
XLSX -
Report Name:
Vists by Period -
Report Type:
Report for list of entities, selected by query
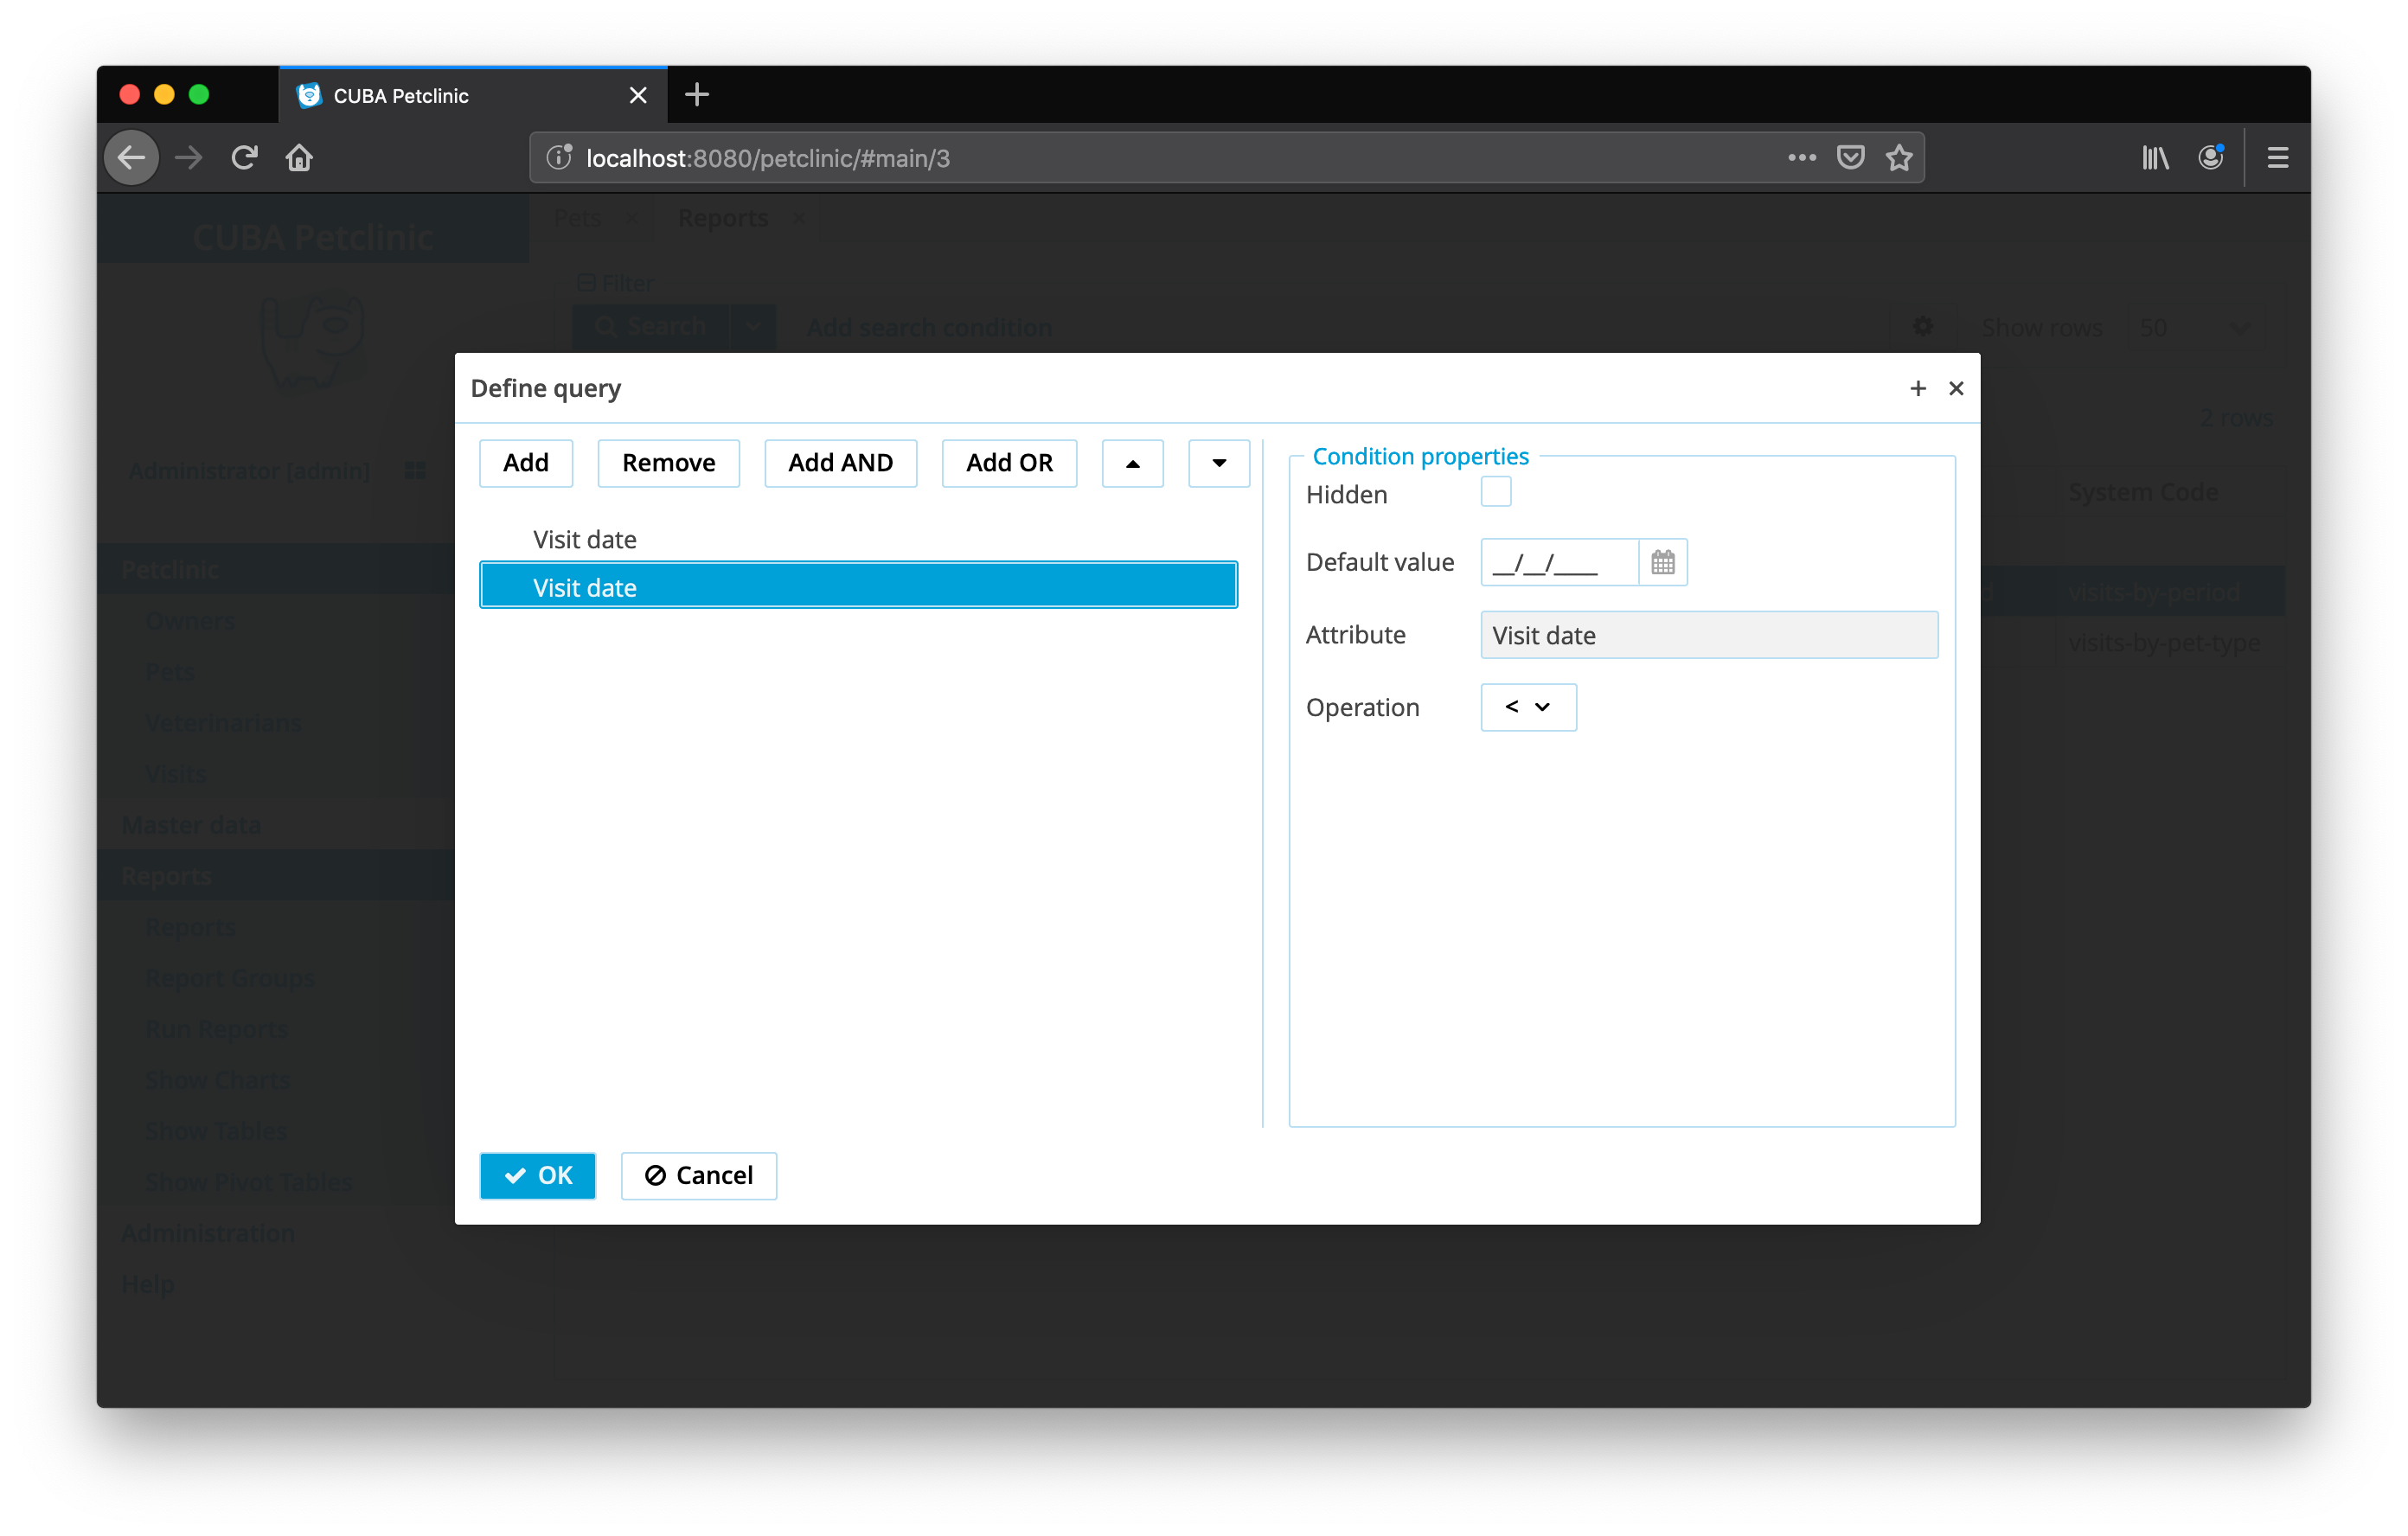
The next step is to define the query. The report Wizard allows users to set the query by defining conditions through the UI.
In this report we need to select the visits of the last month. However, the concept of "relative dates" is not represented in the Reporting add-on directly. So, this piece of logic has to be externalized to the code that triggers the report run.
The report itself is going to be a little more generic in the sense that it allows to specify a period that defines the date range of the visits that will be taken into consideration. This also has the benefit: the report is potentially re-usable for future use-cases.
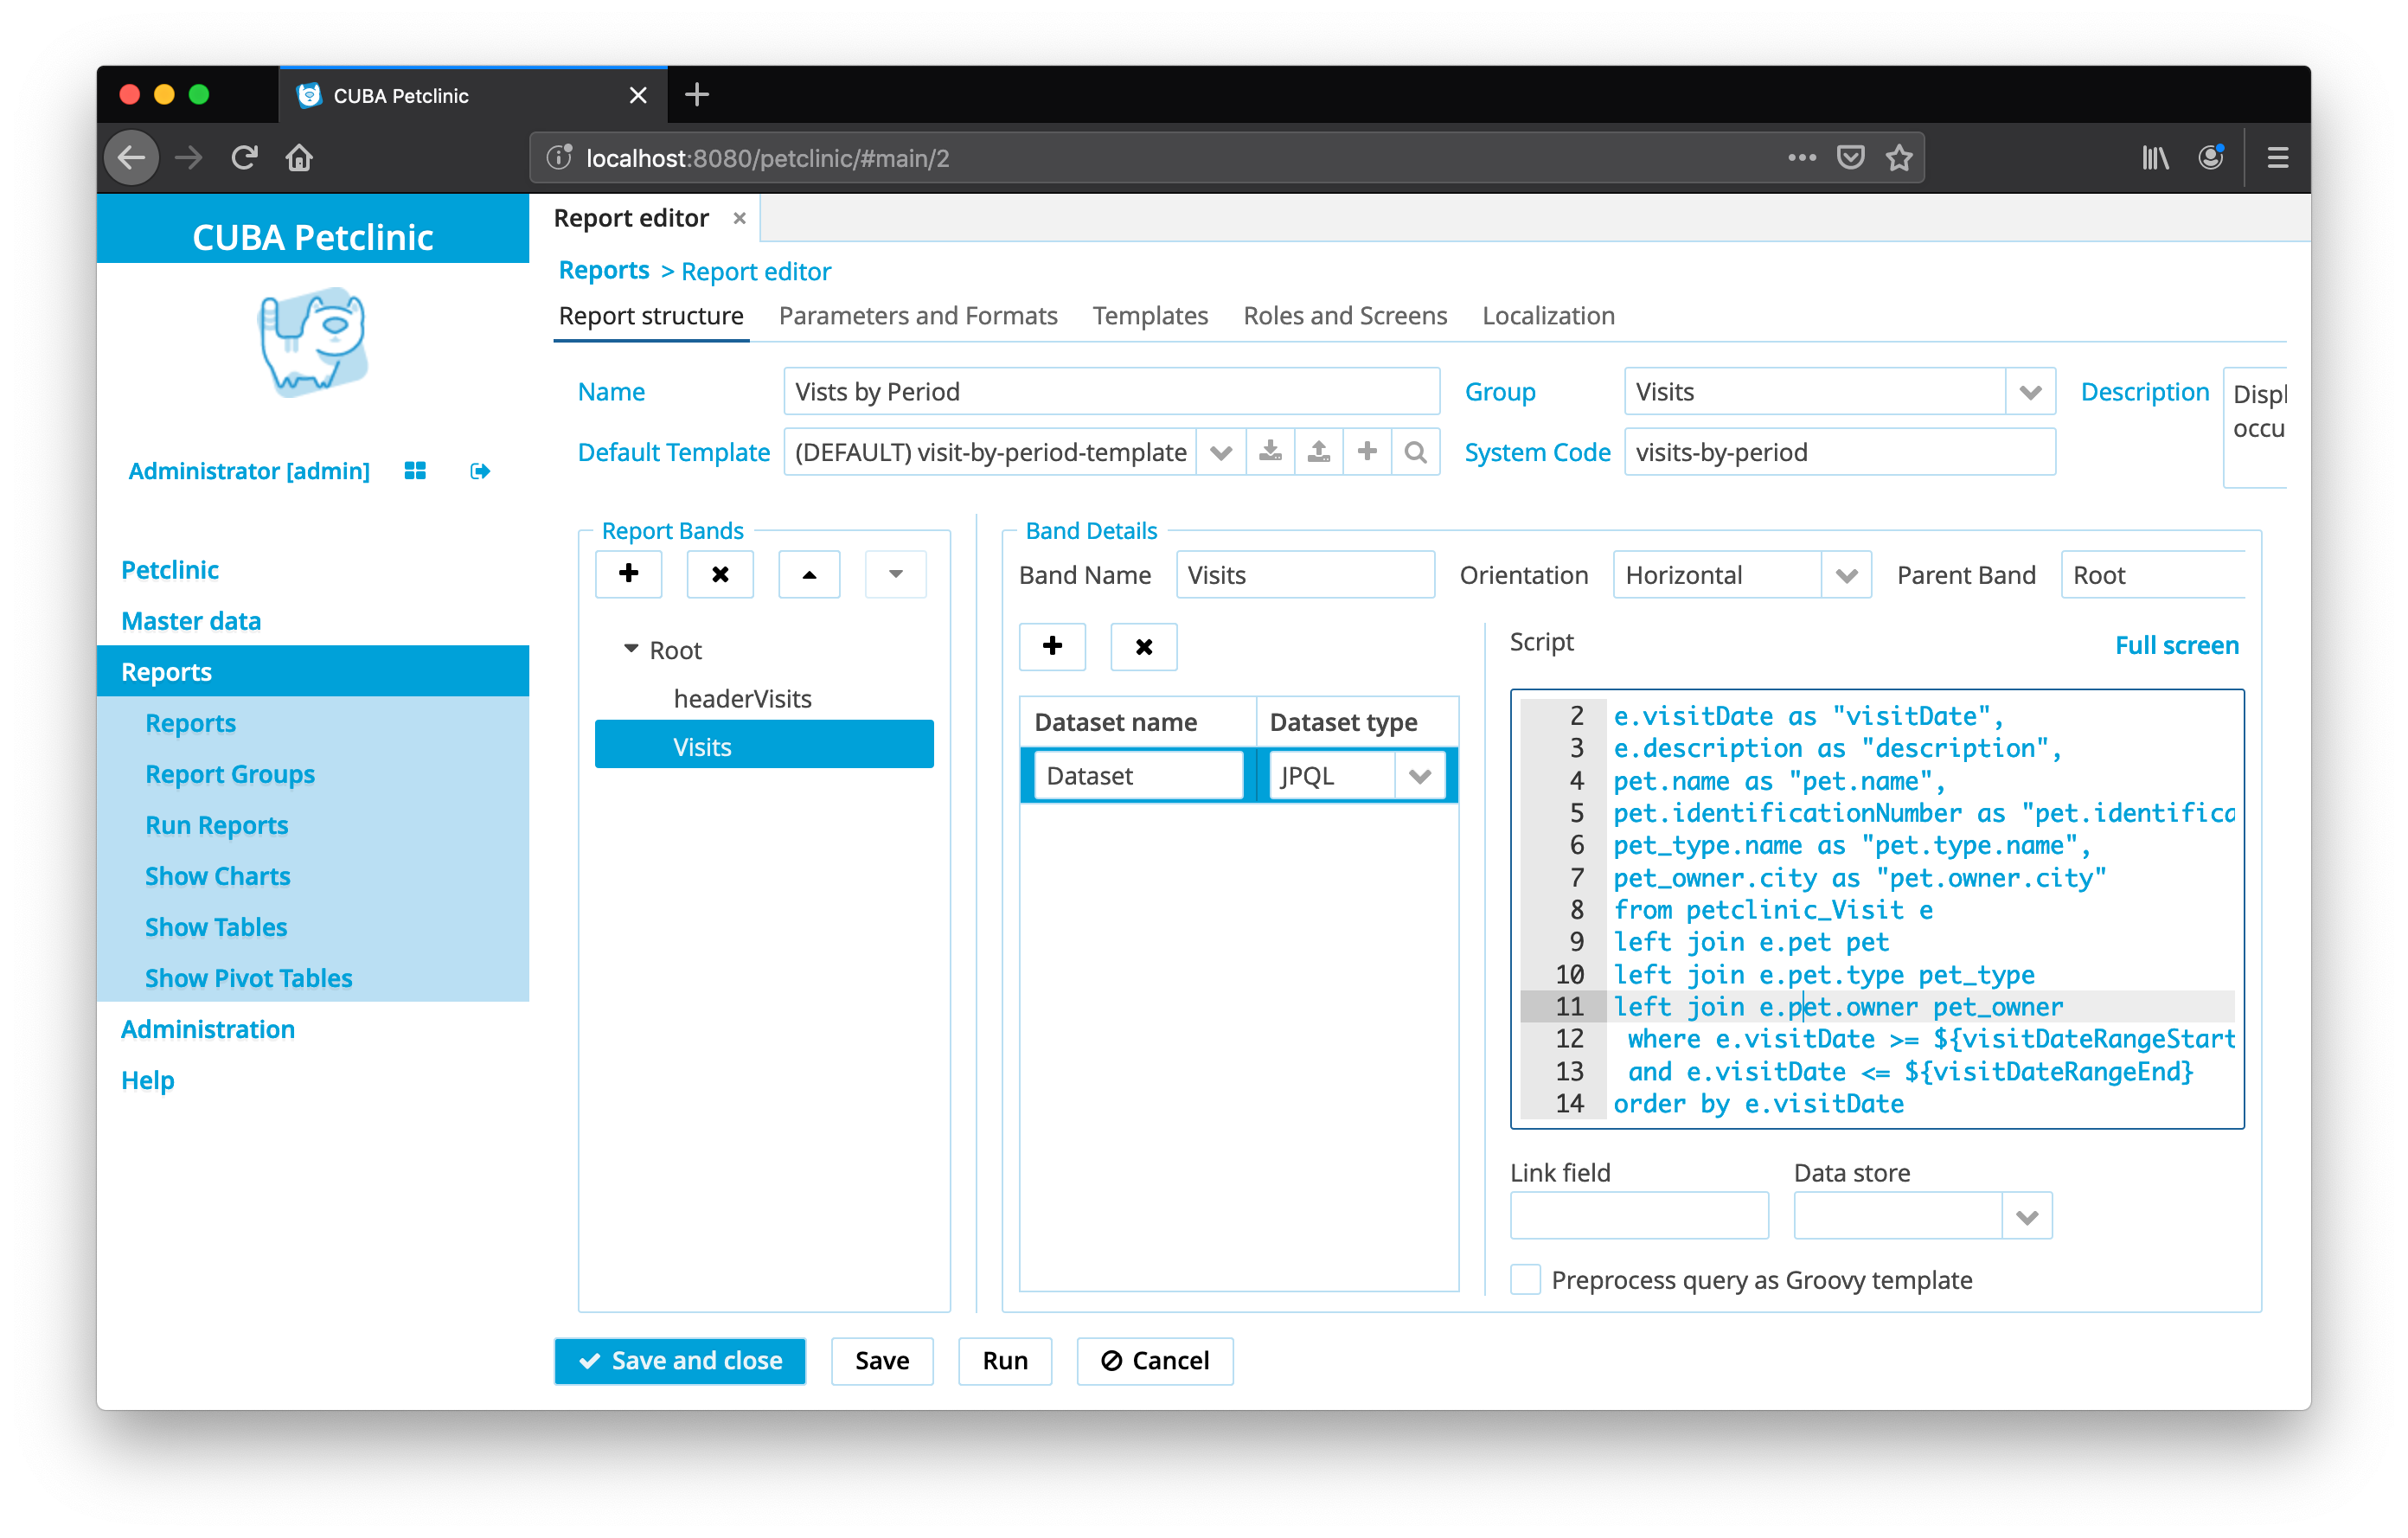
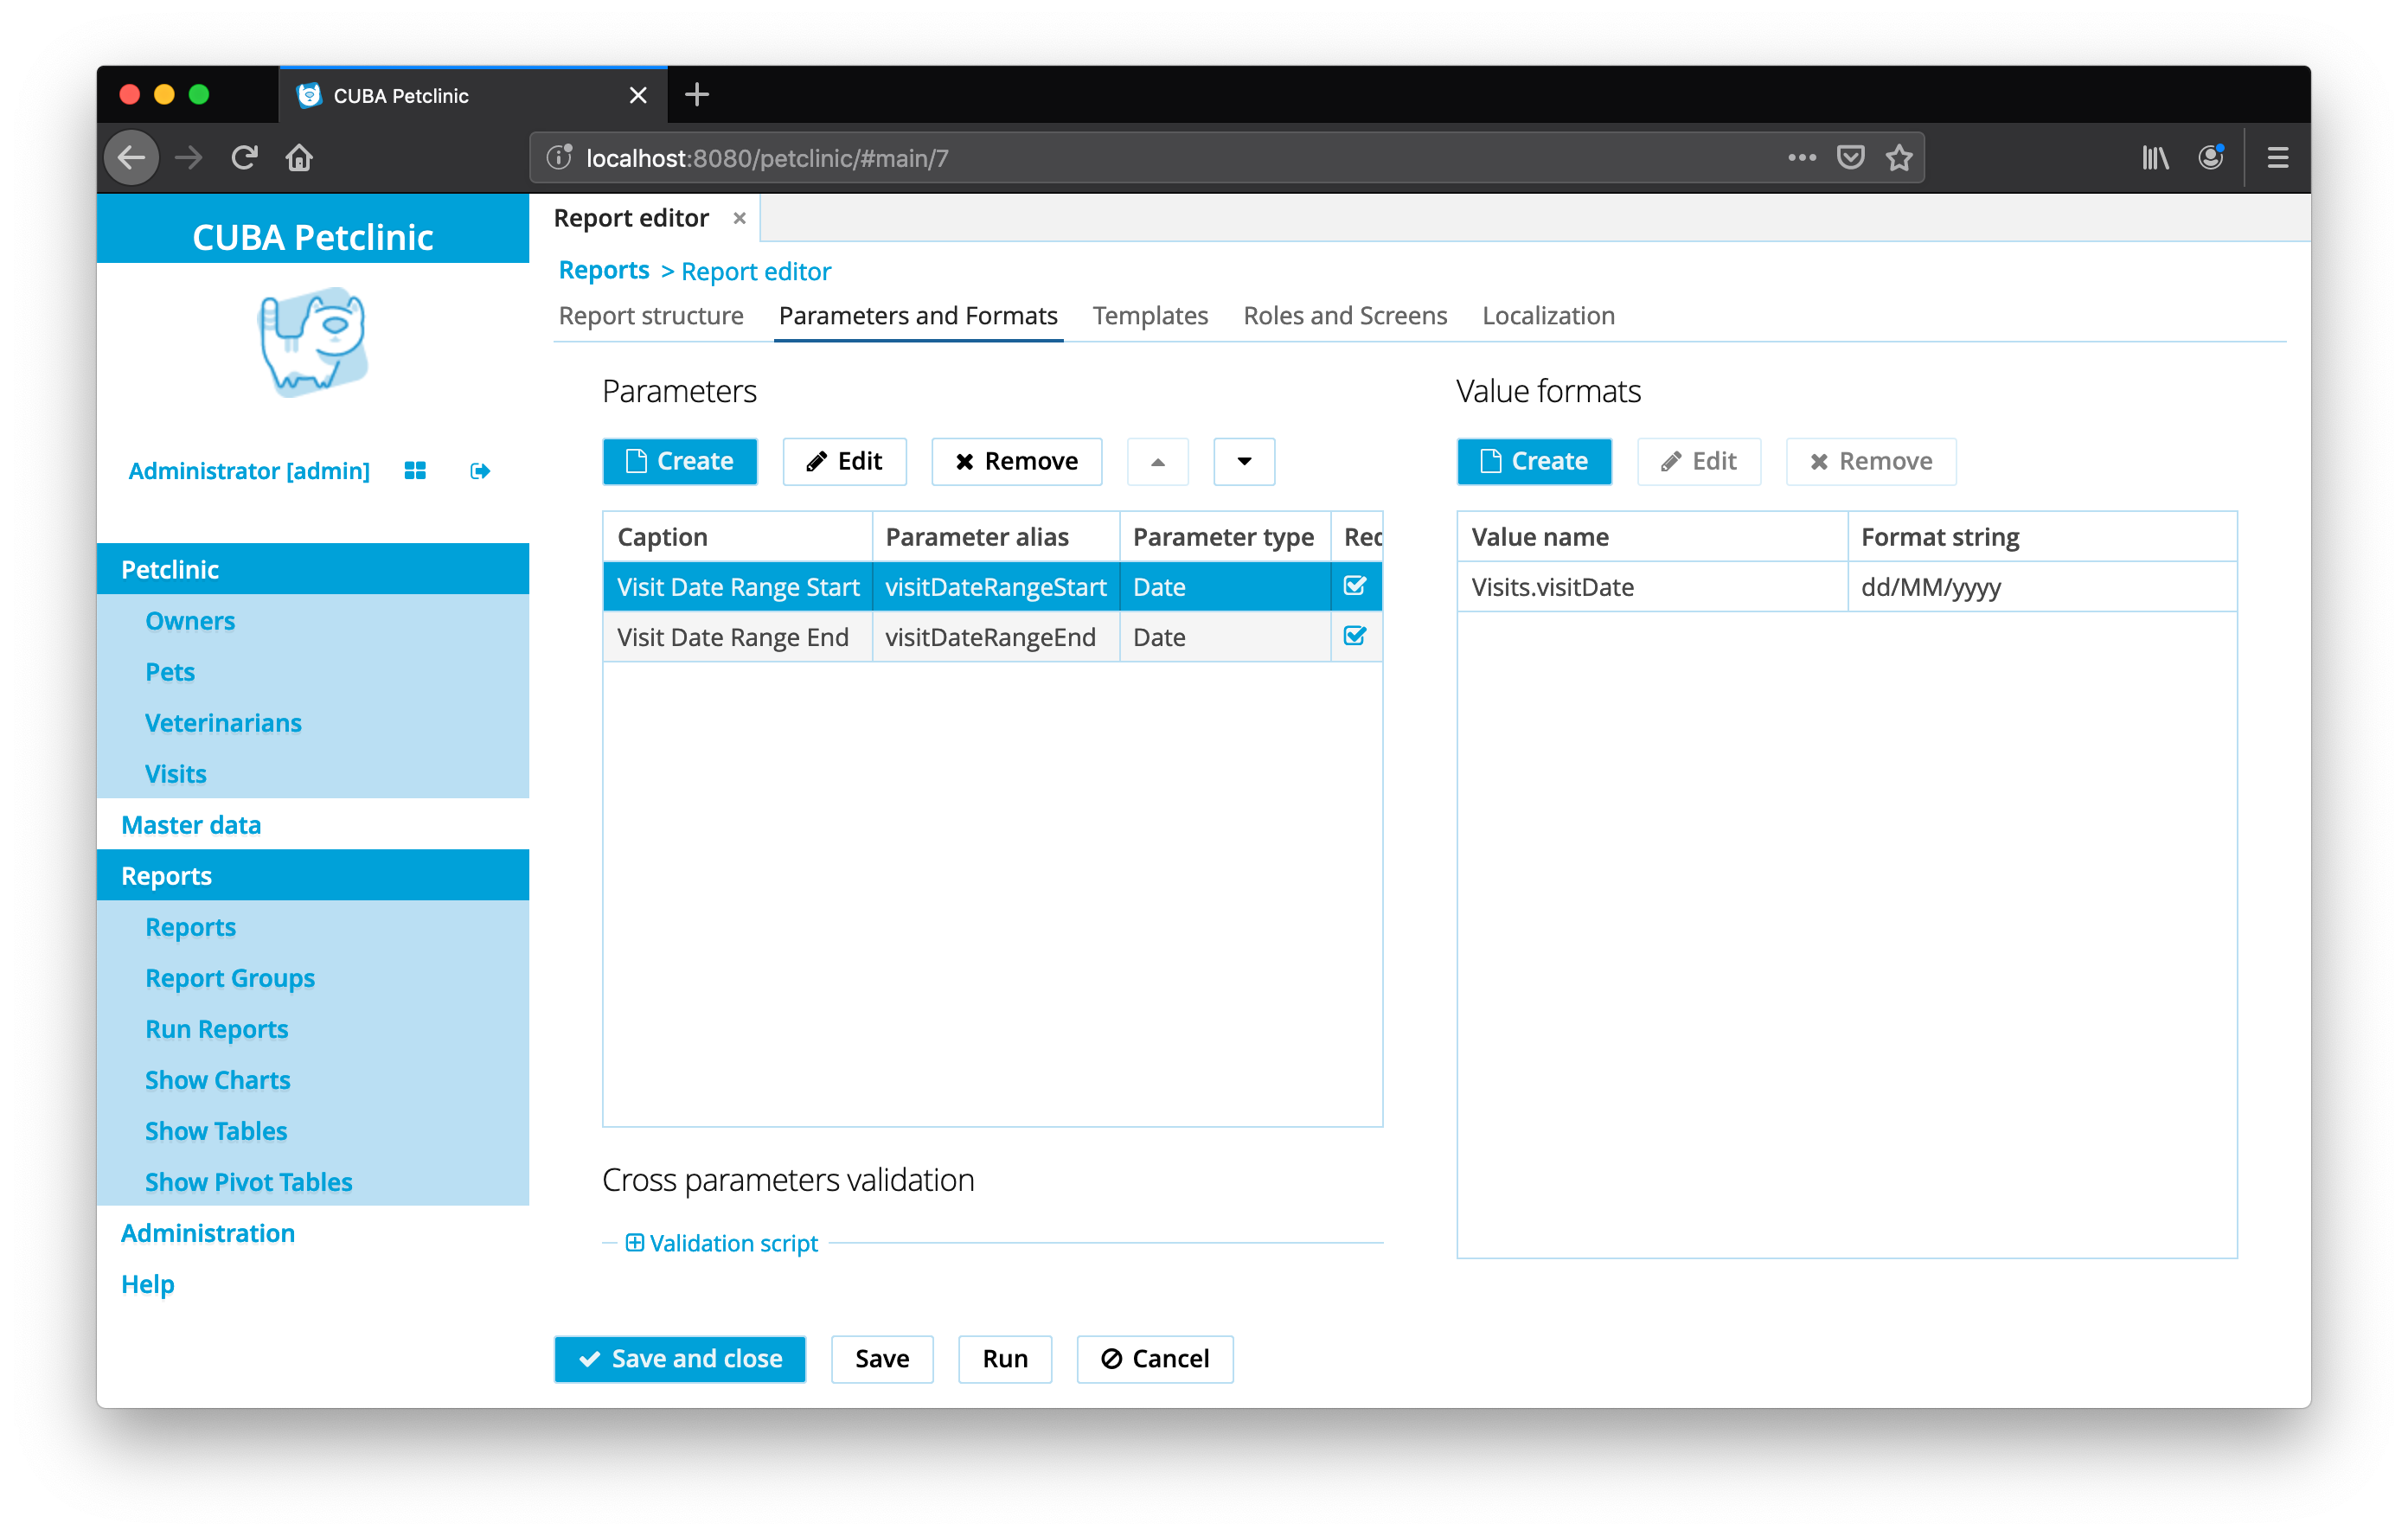
The query consists of two conditions for the attribute visitDate. It should match a value between two dates: "Visit Date Range Start" and "Visit Date Range End". The only difference between the two conditions is that for the first condition the "operation" is greater or equal than: >= while the second condition has the operation smaller than: <. With that, the boundaries of the range are expressed as conditions.
By default the Wizard generates generic parameter names like VisitDate1, VisitDate2 for parameters. In the configuration of the Report within the Tab Parameters and Formats those parameter names can be renamed to something meaningful. In this case we will use visitDateRangeStart and visitDateRangeEnd.
|
For each condition an external parameter will be created so that the concrete values could be inserted programmatically or alternatively by a user through the UI.
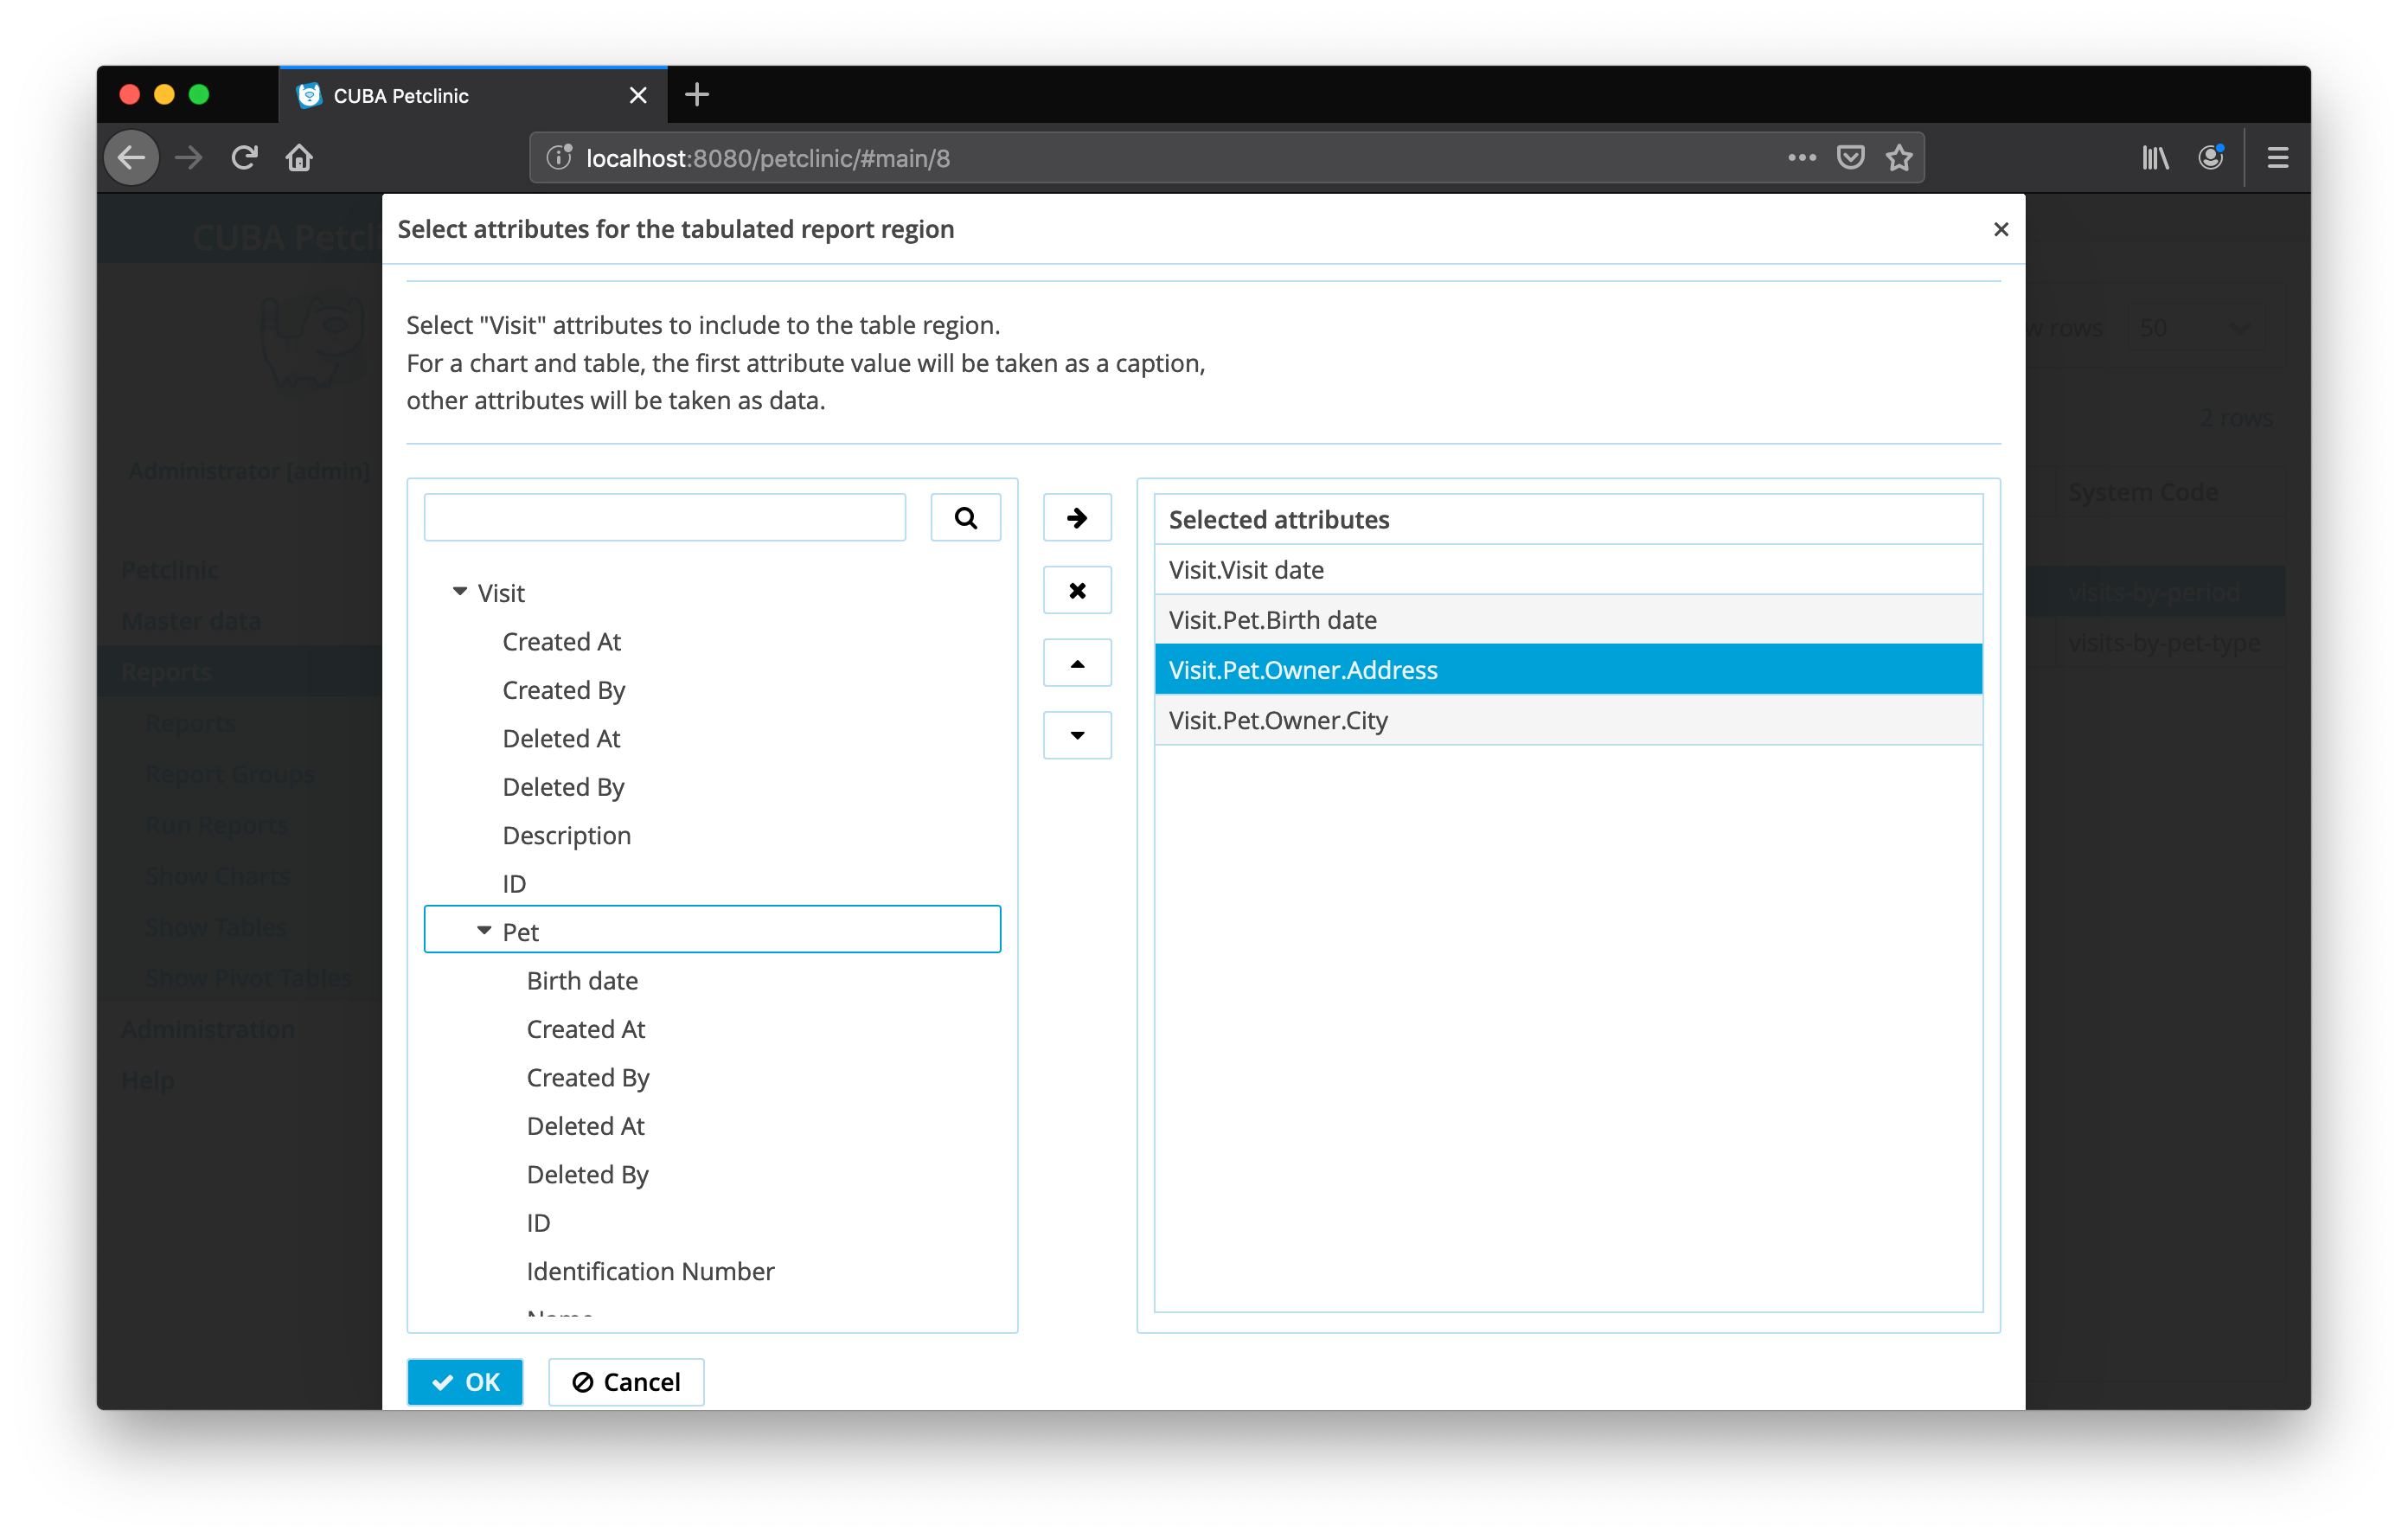
Selecting Entity Attributes of the Visit Entity
The next step in the wizard is to define the attributes of the base entity (Visit) and its associated entities that should be in the report. The selection will influence, on the one hand, the SELECT part of the JPQL statement that is used to fetch the data. On the other hand, it influences the initial version of the columns within the template generated for this report when finishing the report wizard.
For the recent-visits Report, select the following attributes:
-
Visit Date:
visitDate -
Visit Description:
description -
Information about the associated Pet
-
the Pet’s name:
pet.name -
the Pet’s Identification Number:
pet.identificationNumber -
Type of the Pet:
pet.type.name -
The city where the Pet lives (expressed through the address of its owner):
pet.owner.city
-
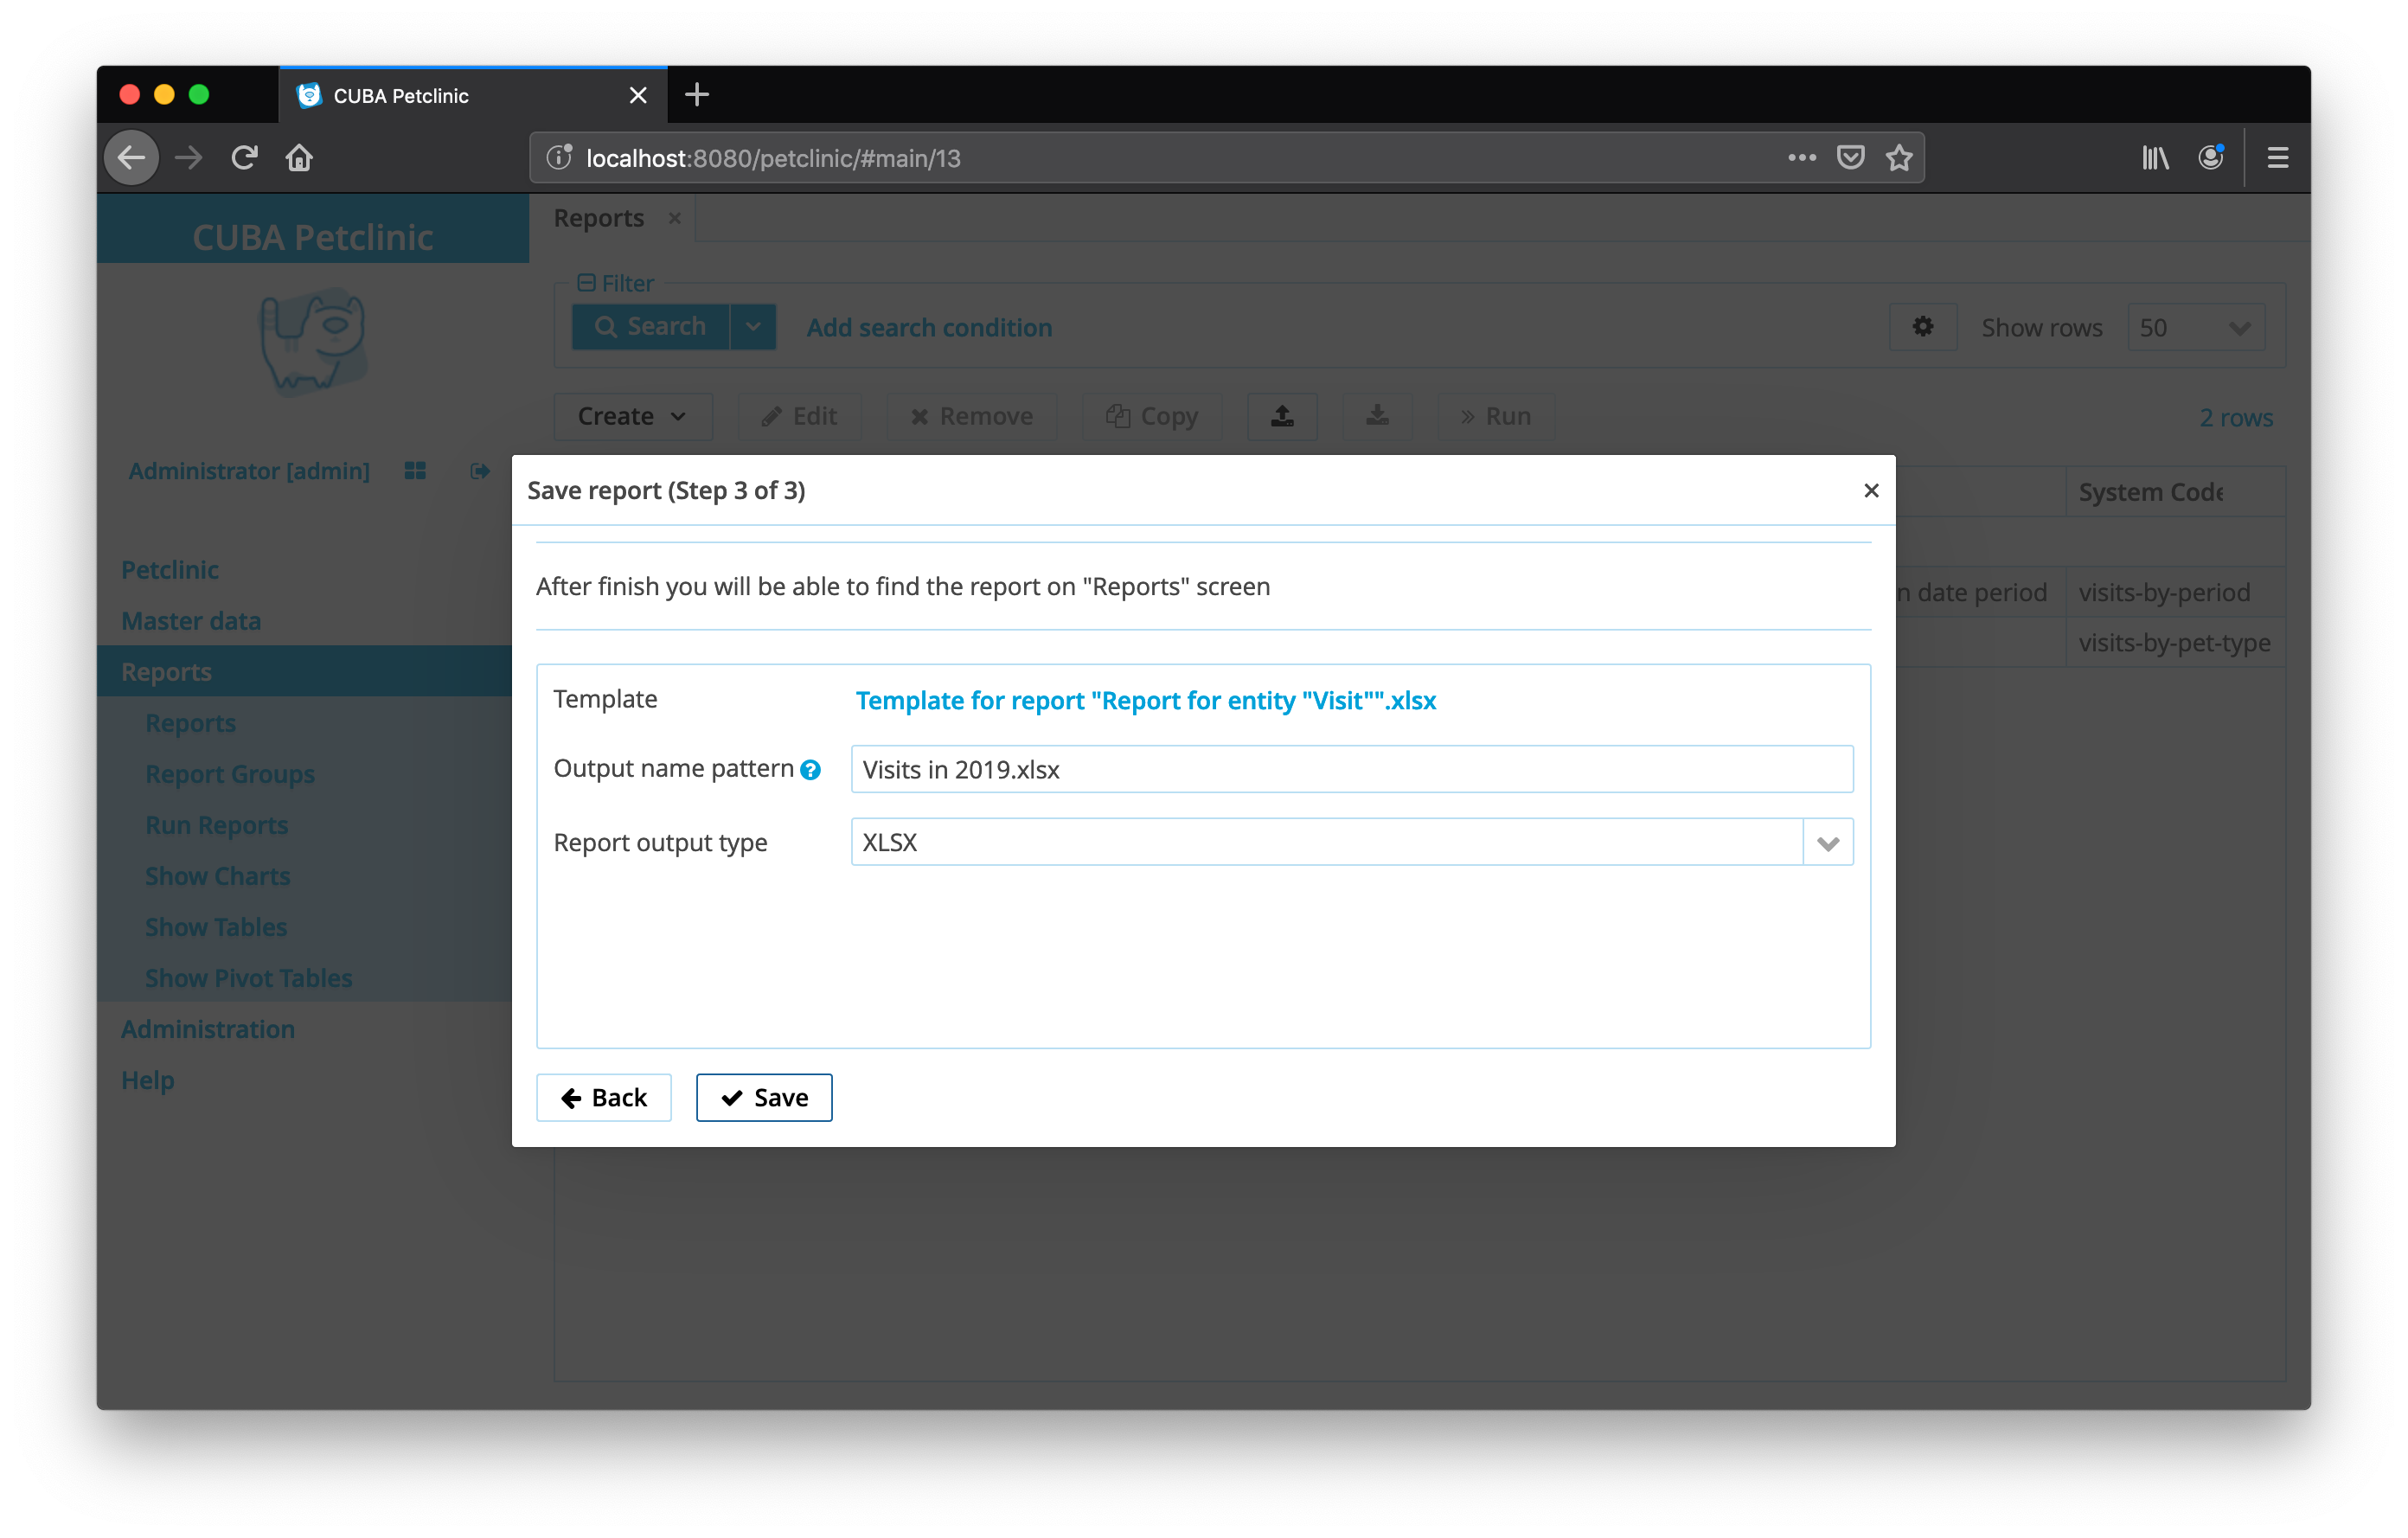
After selecting the attributes through the UI wizard, we can configure the output template file type. In this example, the default settings are applicable.
With that, the report wizard is finished and we can see the report configuration for further adjustments.
Providing External Parameters Programmatically
In case of the recent-visits report, the generic UI is not exposed to the user. Instead, the parameters are passed in by the API call to run the report.
In the patient-record report, the report screen connection was configured in the report configuration.
There is an alternative approach on how to trigger report execution, which you’ll see in the example below.
In this case the report instance is selected programmatically (through the system code attribute) and directly passed into the reports API to execute the report and download the resulting document.
To trigger the recent-visits report follow the steps:
-
identify the last month (externalized logic of relative date)
-
load the report instance to execute
-
trigger the report execution and pass in the last month as a parameter
public class VisitBrowse extends StandardLookup<Visit> {

    @Inject
    protected ReportGuiManager reportGuiManager;

    @Inject
    protected DataManager dataManager;

    @Inject
    protected TimeSource timeSource;

    @Subscribe("visitsTable.lastMonthReport")
    protected void onVisitsTableLastMonthReport(
            Action.ActionPerformedEvent event
    ) {

        TimeRange visitDateTimeRange =
                MonthYearValue
                        .fromDate(today())
                        .minusMonths(1); (1)

        reportGuiManager.printReport( (2)
                loadReportByCode("visits-by-period"), (3)
                ParamsMap.of( (4)
                        "visitDateRangeStart", visitDateTimeRange.getStart(),
                        "visitDateRangeEnd", visitDateTimeRange.getEnd()
                        )
        );
    }

    private LocalDate today() {
        return timeSource.now().toLocalDate();
    }

    private Report loadReportByCode(String reportCode) {
        return dataManager.load(Report.class)
                .query("select e from report$Report e where e.code = :reportCode")
                .parameter("reportCode", reportCode)
                .one();
    }

}| 1 | the last month based on today’s date is identified |
| 2 | reportGuiManager.printReport is the API for executing a report and downloading it immediately |
| 3 | the correct report instance needs to be loaded from the database. Here it is fetched by relying on the code attribute value |
| 4 | a parameter map is passed in containing the start and end date range parameter of the report through the MonthYearValue object |
The main part for passing in the external parameters is the definition of the last month:
TimeRange visitDateTimeRange = MonthYearValue.fromDate(today()).minusMonths(1);.
The TimeRange class is a custom abstraction of the example
application that provides an API to define a Time Range (either a MonthYear range or a Quarter range) and has methods to get the border values of the range.
After the definition of the parameters' values, the reportGuiManager.printReport can pass in a Map of parameters.
The keys of the Map must match the parameterAlias value of the parameter as configured in the Report Entity.
Summary
This introduction to reports and documents generation explained the building blocks of the CUBA Reporting add-on. A report is the concept that enables merging a document template with data from data sources to produce an output document.
Both building blocks, the document template and the data sources, can be of various kinds. With that it provides a high degree of flexibility when configuring reports to generate output documents.
All this configuration is held in the main entity: Report, which can be created through a UI wizard or manually through the configuration UI. With that differentiation it supports users with different levels of technical capabilities.
You can run a report directly through a generic user interface, or programmatically through the application code. You can define external parameters passed into the report. Also, you can configure reports in a more generic manner to support multiple use-cases.
In this guide we learned how to create two reports. The first report uses the PDF generation to create a patient record for a pet. The report uses the screens configuration to declaratively configure in which screens the report should be offered.
The second report generates an Excel sheet with the visits of the last month. In this case external parameters were leveraged to dynamically pass in a specific date range for the report to work on.