


The most recent iteration of Jmix, version 2.2, has just been released. In this article, we'll delve into the fresh features and improvements introduced in this update.
To find out more details and guidance on migrating, make sure to visit the What's New page in the documentation.
Charts Add-on
Perhaps the most notable new feature of Jmix 2.2 is the long awaited Charts add-on. It integrates Apache ECharts, an open-source JavaScript charts library, into Jmix UI. Now you can use the full power of ECharts by configuring it in XML or Java in your Jmix application and easily connect to your data on the server side as the other UI components.
For example, having a VehicleCount entity which stores the number of different vehicles by year in the cars, motorcycles, bicycles and year attributes, you could configure a chart for data visualization as follows:
<data>
    <collection id="vehiclesDc"
                class="com.company.demo.entity.VehicleCount">
        <fetchPlan extends="_local"/>
        <loader id="vehiclesDl" readOnly="true">
            <query>
                <![CDATA[select e from VehicleCount e order by e.year]]>
            </query>
        </loader>
    </collection>
</data>
<layout>
	<charts:chart id="chart">
	    <charts:dataSet>
	        <charts:source dataContainer="vehiclesDc"
	                       categoryField="year"
	                       valueFields="cars motorcycles bicycles"/>
	    </charts:dataSet>
	    <charts:series>
	        <charts:bar name="Cars"/>
	        <charts:bar name="Motorcycles" stack="stack"/>
	        <charts:bar name="Bicycles" stack="stack"/>
	    </charts:series>
	    <charts:xAxes>
	        <charts:xAxis/>
	    </charts:xAxes>
	    <charts:yAxes>
	        <charts:yAxis>
	            <charts:axisLabel formatter="{value}"/>
	        </charts:yAxis>
	    </charts:yAxes>
		<charts:title text="Vehicles" subtext="By Year"/>
		<charts:legend/>
	</charts:chart>
As you can see, the chart connects to a data container using the source element and defines how to display data in the series element. The resulting chart is shown below:
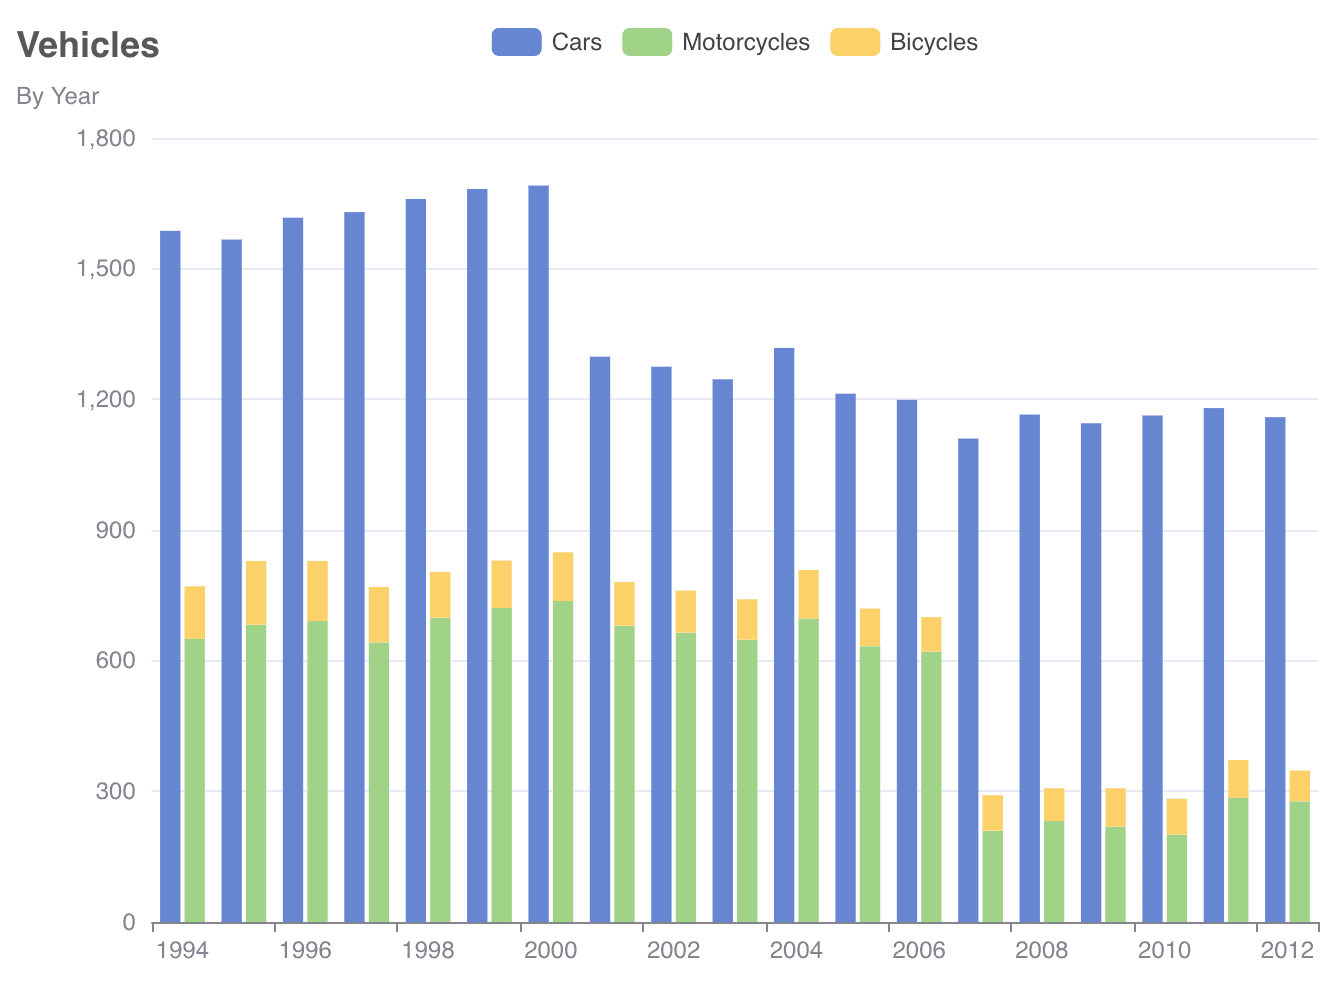
We have tried to make the XML and Java chart API as close as possible to the native JavaScript API of ECharts, making it straightforward to configure a chart in Jmix by referring to the comprehensive ECharts documentation.
The Charts add-on is available for free on the Marketplace and can be used in any project based on Jmix 2.2.
Maps Add-on Improvements
The Maps add-on has received new important features: ability to display MultiPoint, MultiLine and MultiPolygon geometries, heatmap layers, and clustering.
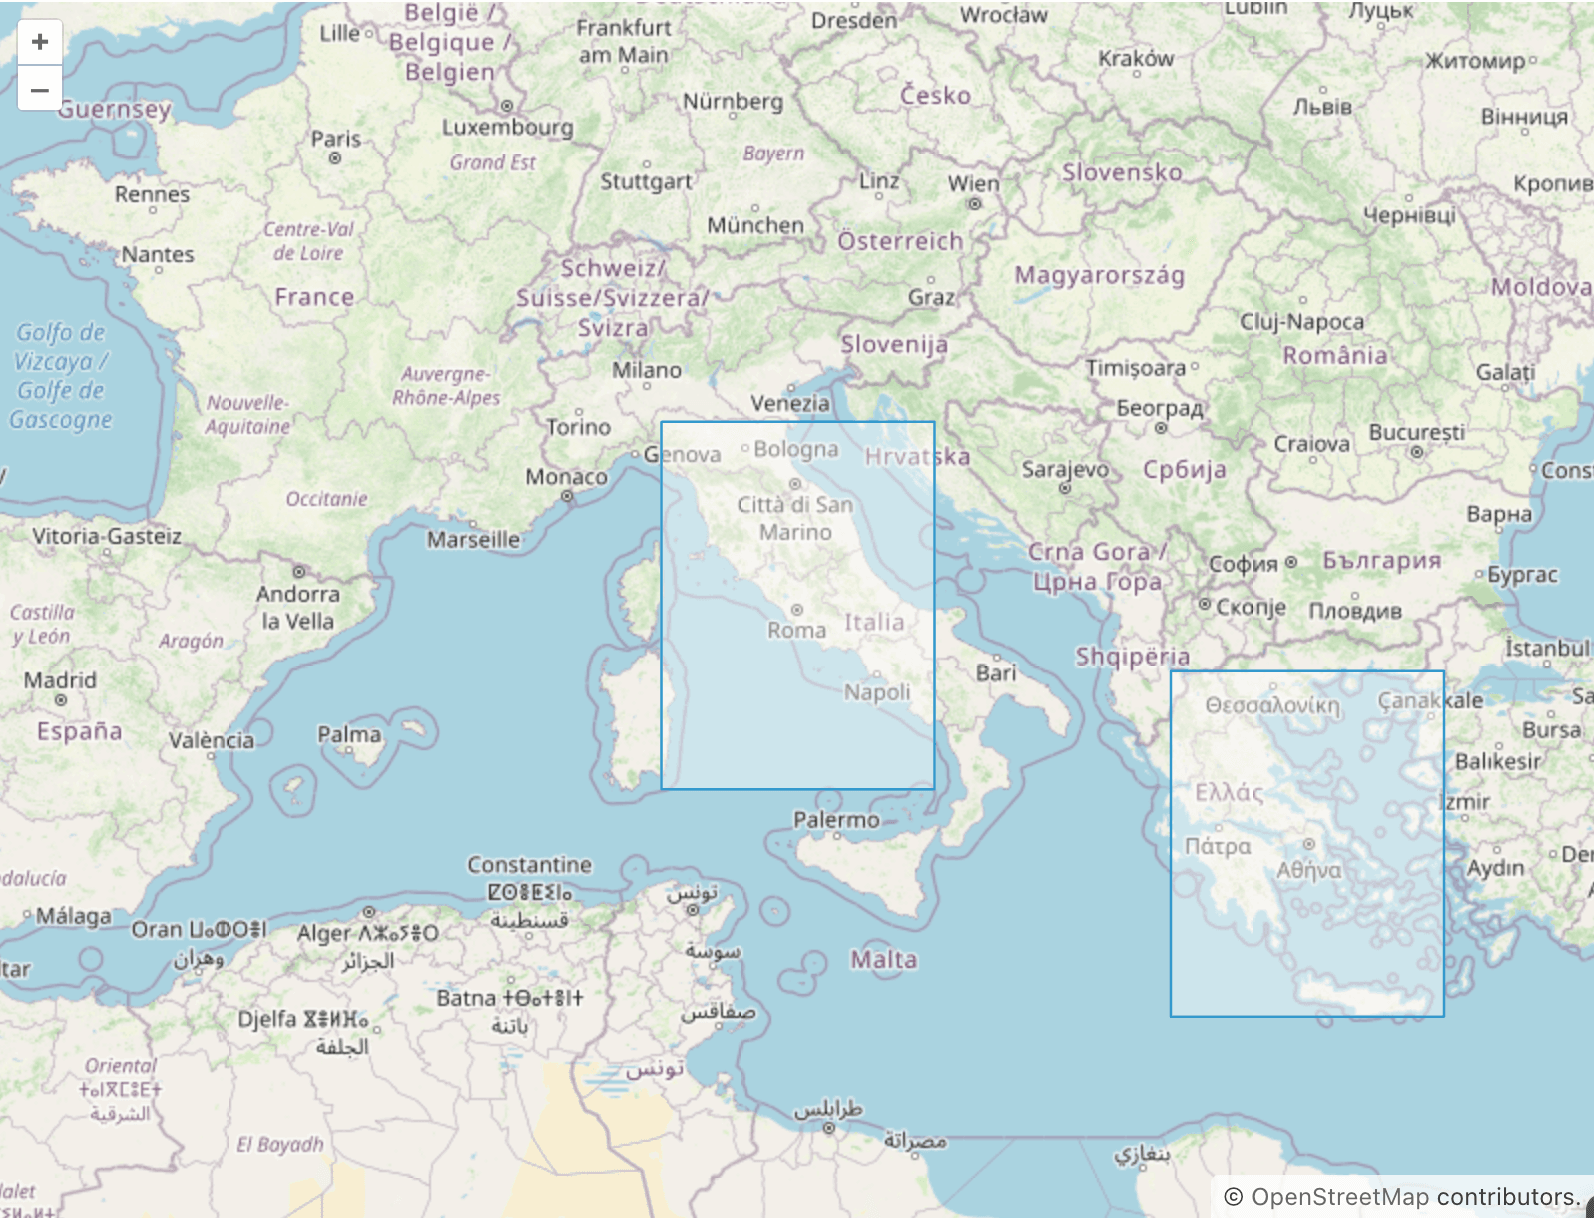
A MultiPolygon is just a collection of polygons in a single geometry. In the example below, we create a multipolygon consisting of two rectangles:
private void addMultiPolygon(VectorSource vectorSource) {
    GeometryFactory factory = GeometryUtils.getGeometryFactory();
    Polygon polygon1 = factory.createPolygon(
            factory.createLinearRing(new Coordinate[]{
                    new Coordinate(15.5, 38.9),
                    new Coordinate(15.5, 44.9),
                    new Coordinate(9.5, 44.9),
                    new Coordinate(9.5, 38.9),
                    new Coordinate(15.5, 38.9)}));
    Polygon polygon2 = factory.createPolygon(
            factory.createLinearRing(new Coordinate[]{
                    new Coordinate(20.7, 40.9),
                    new Coordinate(26.7, 40.9),
                    new Coordinate(26.7, 34.9),
                    new Coordinate(20.7, 34.9),
                    new Coordinate(20.7, 40.9)}));
    MultiPolygon multiPolygon = factory.createMultiPolygon(new Polygon[]{polygon1, polygon2});
    vectorSource.addFeature(new MultiPolygonFeature(multiPolygon));
}
It will be shown on the map as follows:
The clustering feature allows you to display a large number of markers on a map by consolidating them. In the following example, the map shows the most famous cities founded by the Romans:
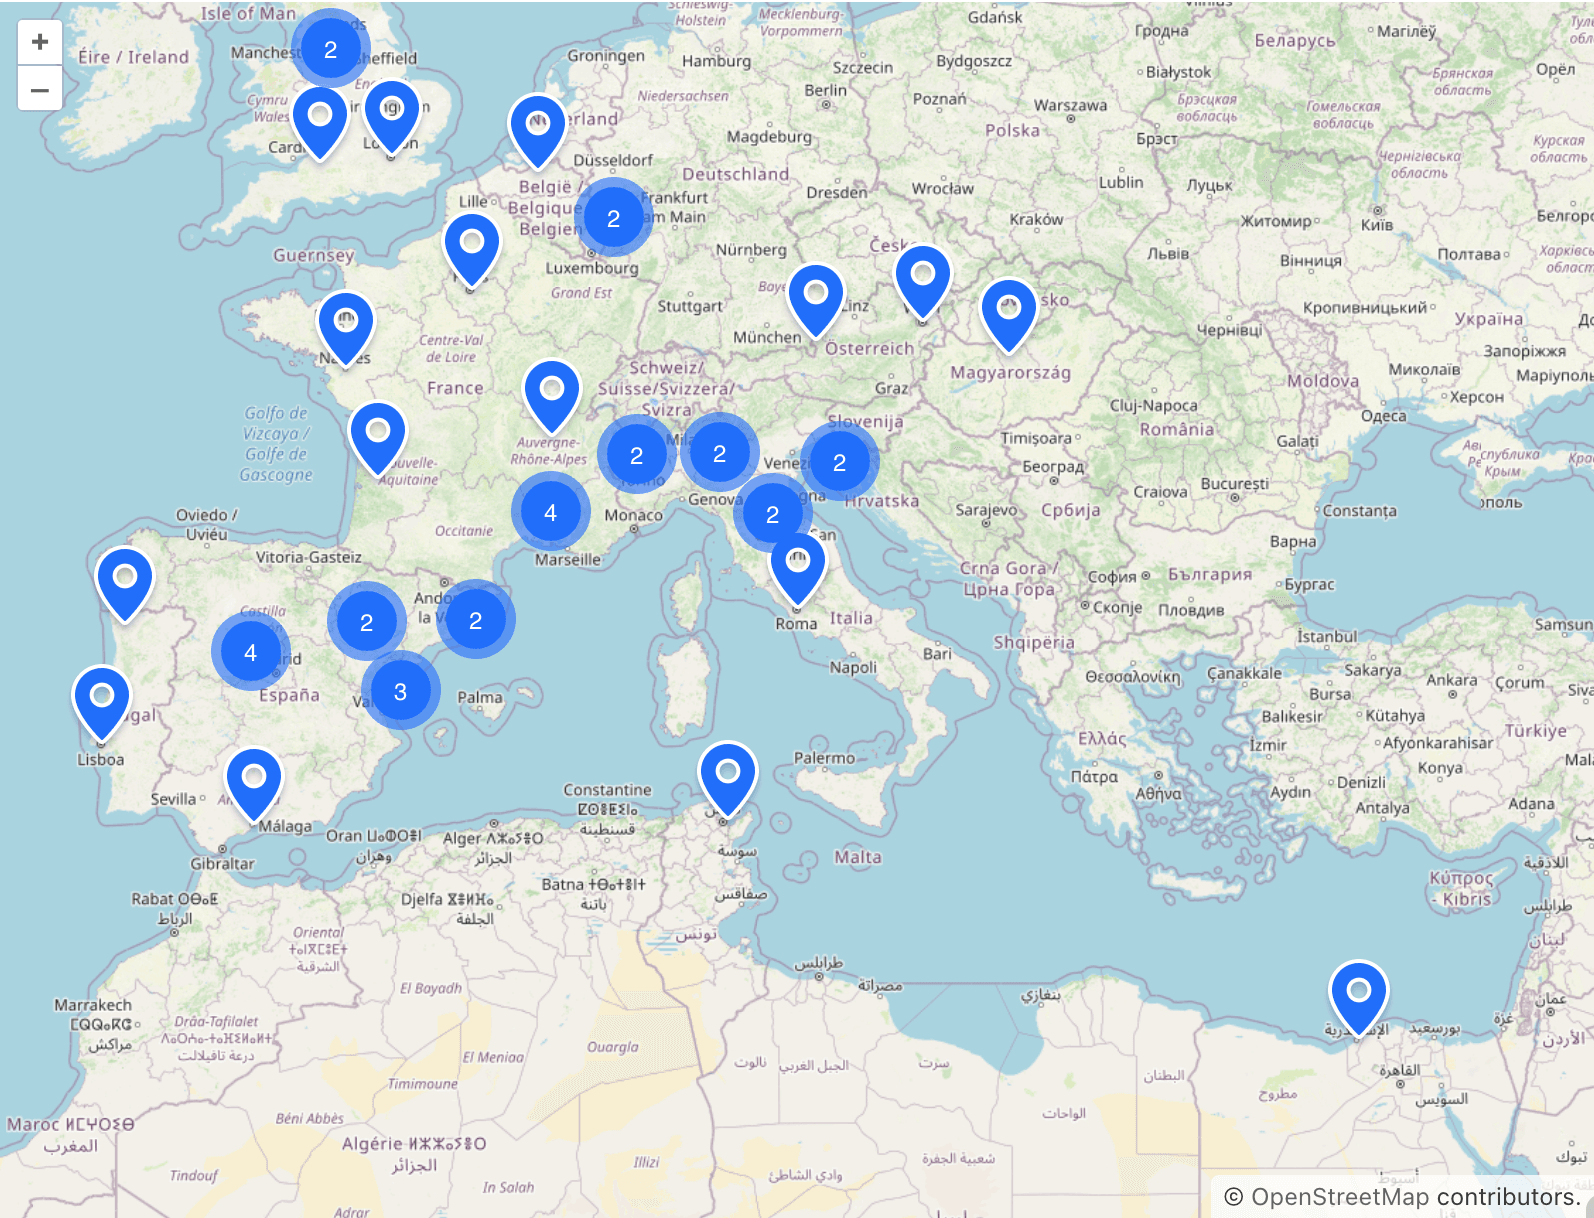
This is achieved simply by wrapping the vector data source into the cluster element in view XML:
<maps:geoMap>
    <maps:layers>
        <maps:tile>
            <maps:osmSource/>
        </maps:tile>
        <maps:vector id="cityLayer">
            <maps:cluster distance="30">
                <maps:dataVectorSource dataContainer="citiesDc" property="point"/>
            </maps:cluster>
        </maps:vector>
    </maps:layers>
    <maps:mapView centerY="41.9" centerX="12.48" zoom="4.5"/>
</maps:geoMap>
The same data can be visualized in a heatmap, where the values are represented by color:
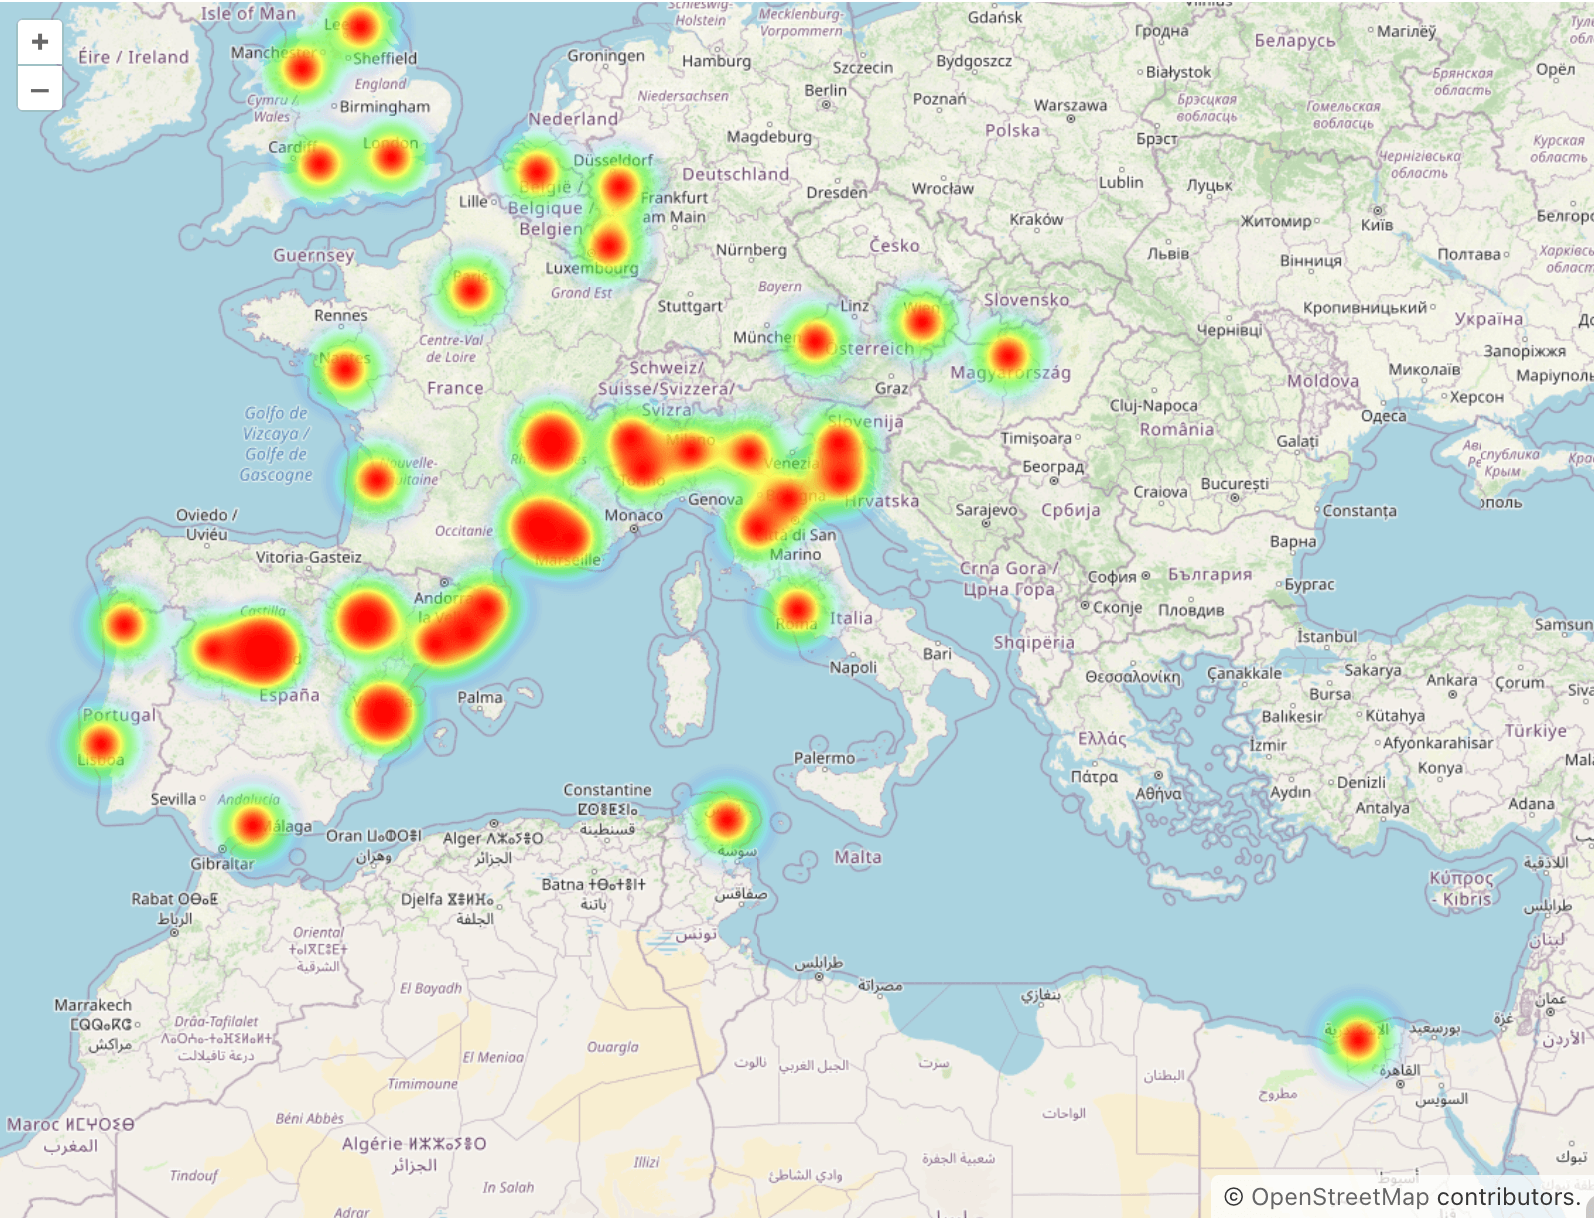
The heatmap is configured by a special heatmap layer with its own data source connected to the same data container:
<maps:geoMap>
    <maps:layers>
        <maps:tile>
            <maps:osmSource/>
        </maps:tile>
        <maps:heatmap radius="15">
            <maps:heatmapDataVectorSource dataContainer="citiesDc" property="point"/>
        </maps:heatmap>
    </maps:layers>
    <maps:mapView centerY="41.9" centerX="12.48" zoom="4.5"/>
</maps:geoMap>
Improvements in BPM
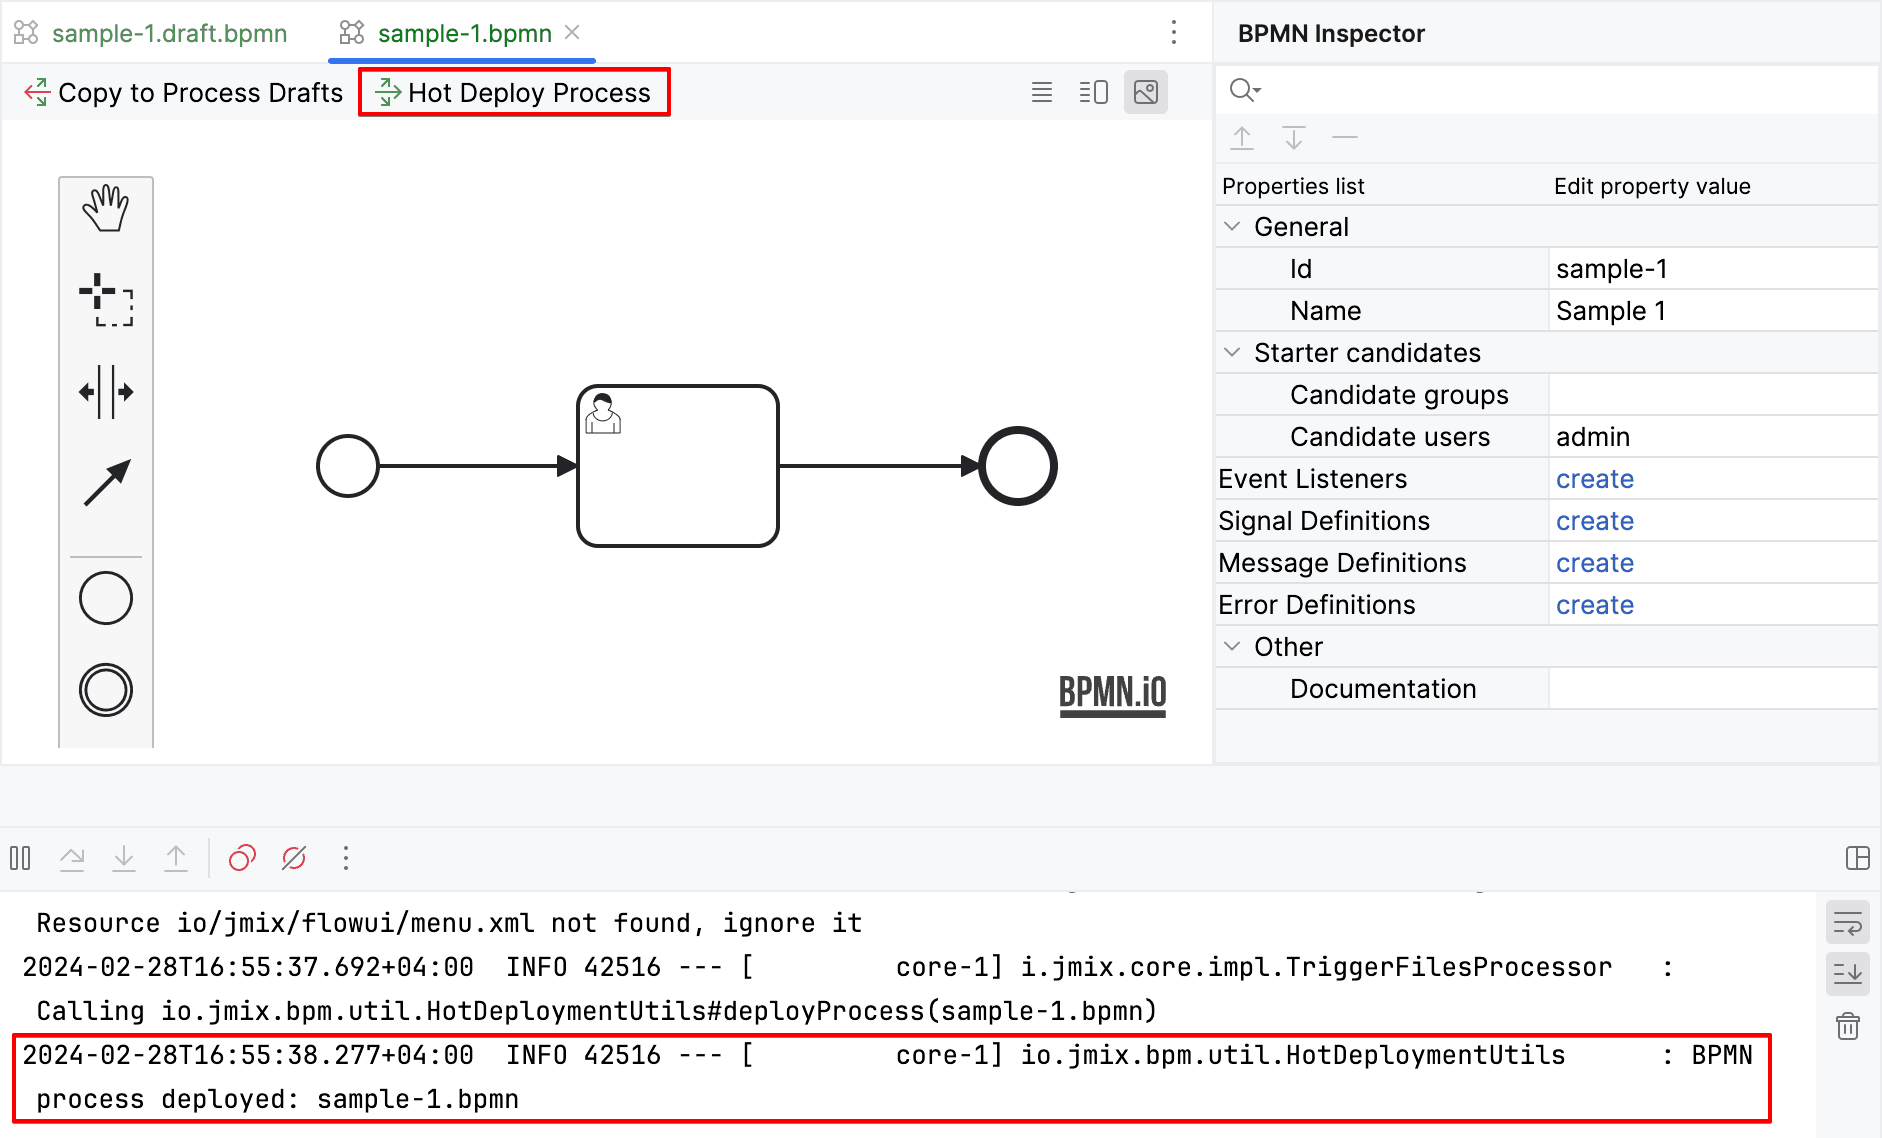
In order to shorten the feedback loop when developing processes in Studio, we have implemented hot deployment of process definitions into the running application. You can find the Hot Deploy Process button in the top panel of the BPMN designer. The application prints a message in the log when a process is deployed successfully:
The process form wizard in Studio can now generate a form for the start event. Such a form will contain a Start process button which invokes the process engine API.
This wizard also contains the new Process form for entity instance item in the Form template dropdown. If you choose this option, the wizard will allow you to select or create a variable of the Entity type. The resulting process form will contain a data container and a field for editing the selected entity.
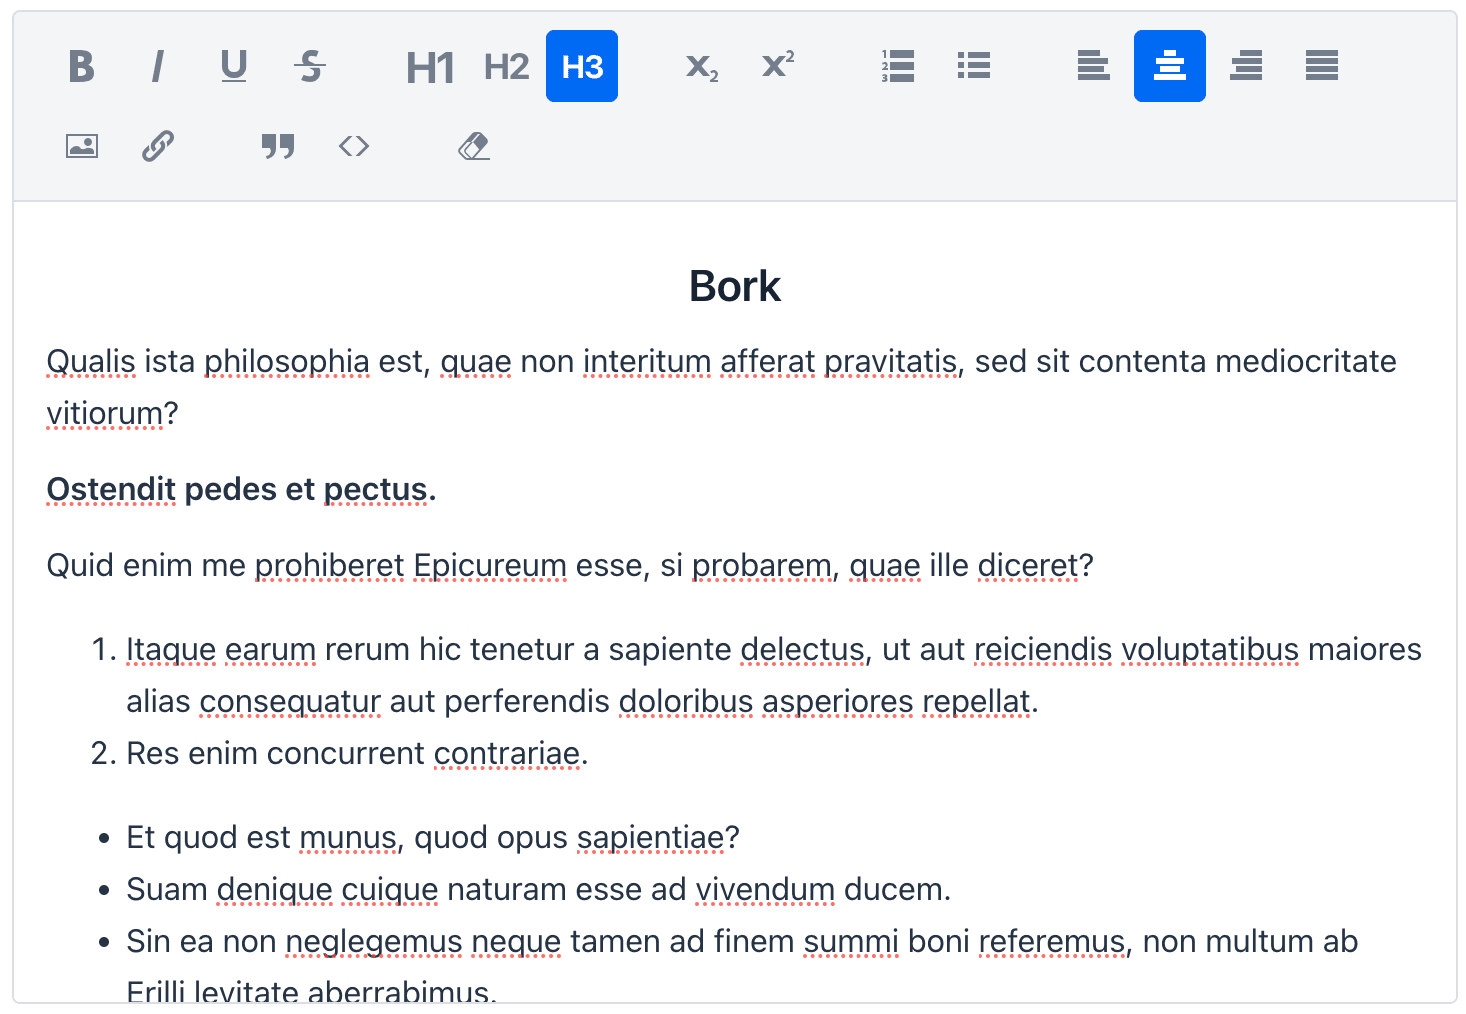
RichTextEditor Component
The new richTextEditor component based on the Quill JavaScript library allows you to edit text with formatting and save it as HTML:
The component is data-aware and can be easily connected to your data model:
<richTextEditor id="descriptionField" width="100%"
                dataContainer="stepDc" property="description"/>
Improvements in Main View
The new menuFilterField component allows users to filter main menu items.
You just need to put the filter field somewhere on the view and connect it to listMenu:
<menuFilterField menu="menu"
                 placeholder="Search..." classNames="ms-s me-s"/>
<nav id="navigation" classNames="jmix-main-view-navigation" ariaLabel="msg://navigation.ariaLabel">
    <listMenu id="menu"/>
</nav>
The menu filtering in action:
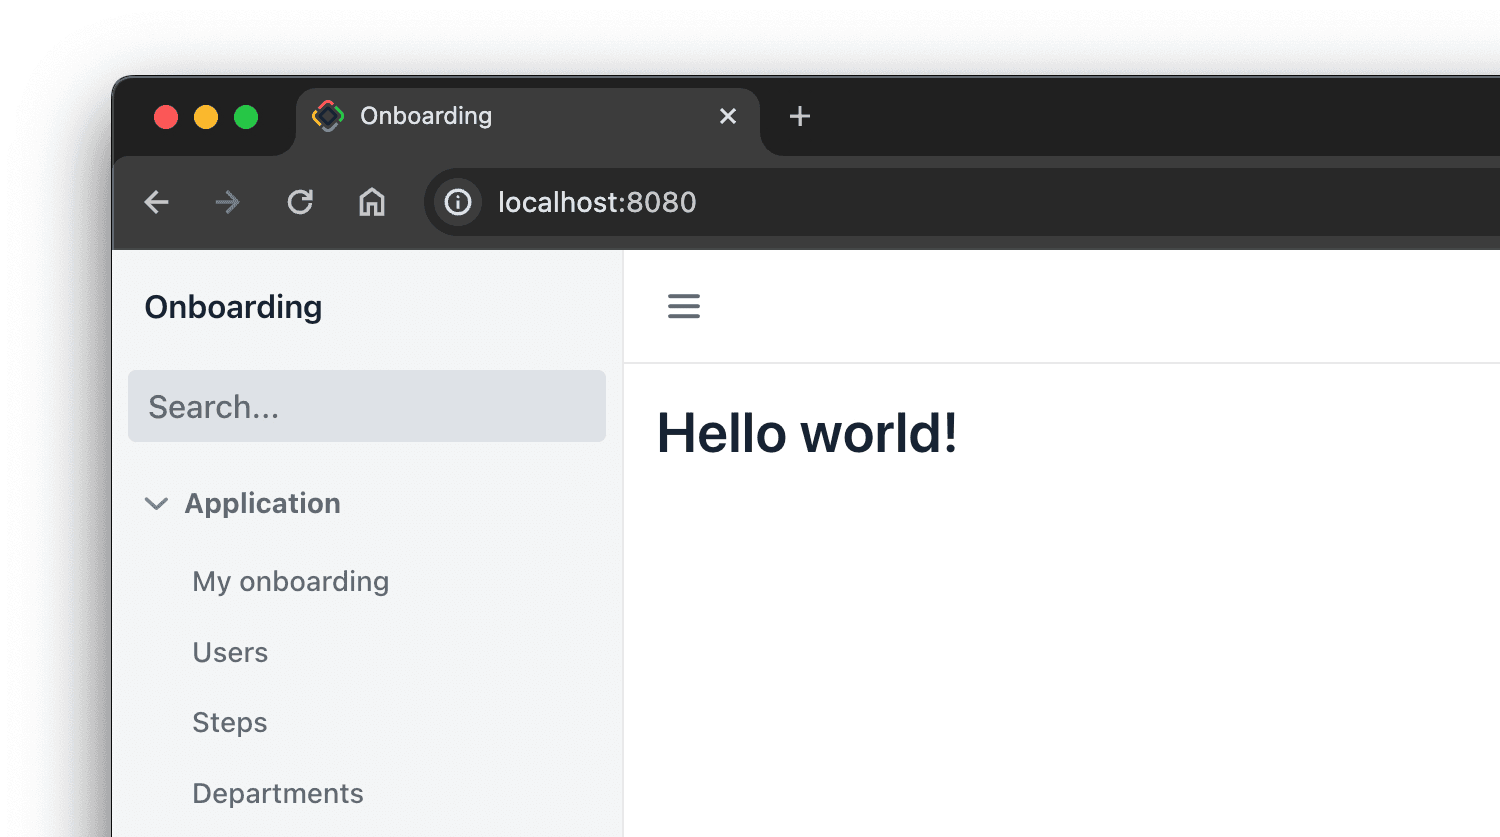
The next improvement related to the main view is the ability to declaratively define the content when no child views are open. Use the initialLayout element of the appLayout component:
<appLayout>
    <navigationBar .../>
    <drawerLayout .../>
    <initialLayout>
        <h2 text="Hello world!"/>
    </initialLayout>
</appLayout>
Then your application will look as follows:
And probably the most anticipated enhancement in this area is the horizontal main menu:
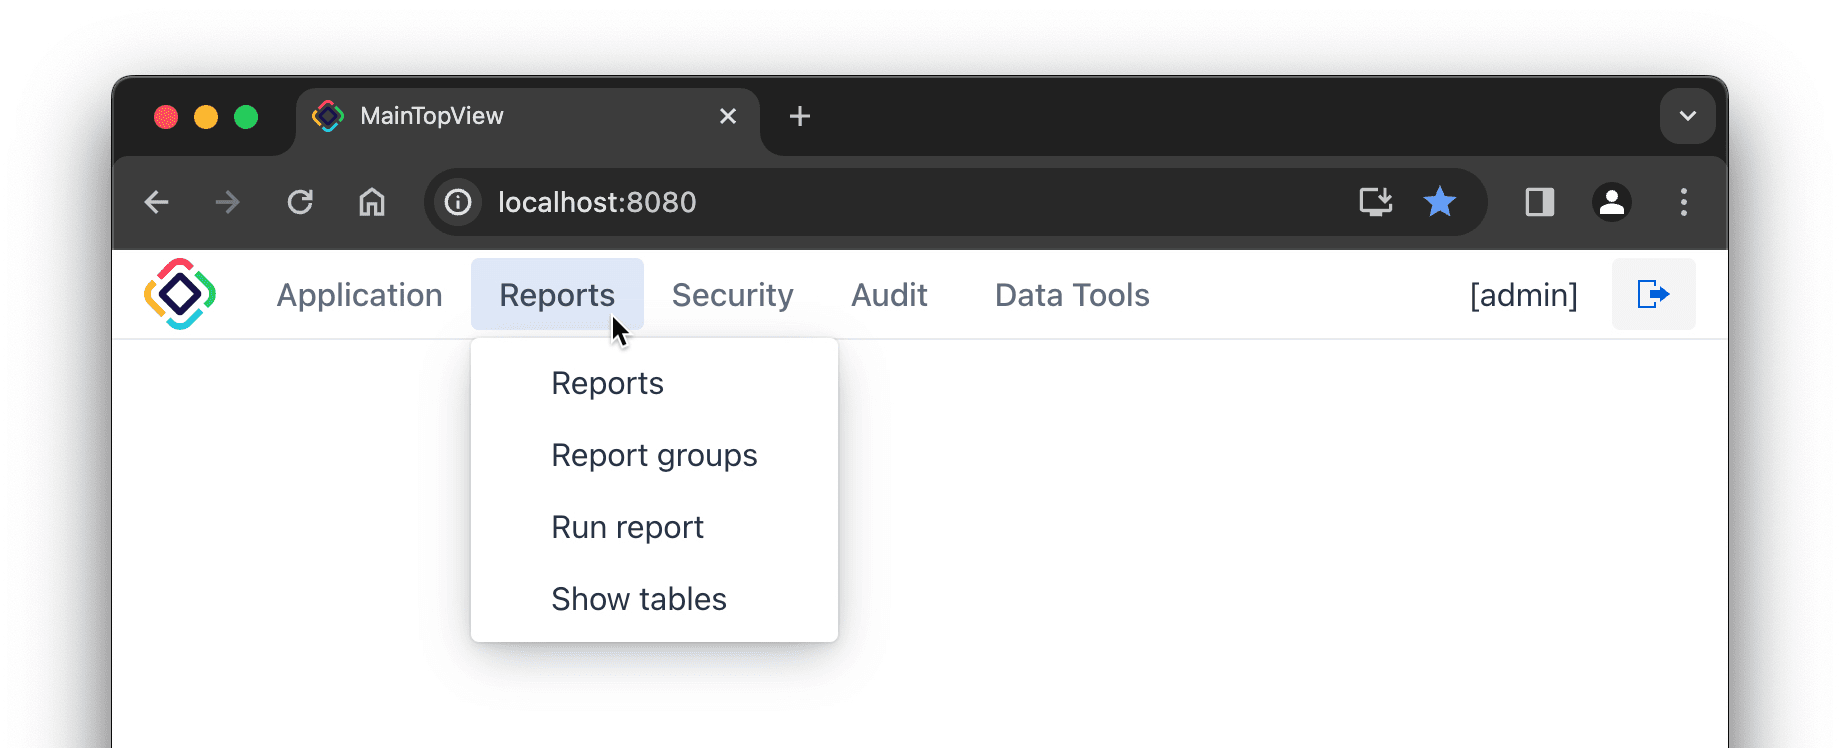
It's implemented by the horizontalMenu component which obtains the menu structure from the same menu.xml descriptor. So you can easily replace the standard vertical listMenu by the top horizontal menu at any moment in your project. The simplest way to do it is to click New → View and select the Main view with top menu template. If you select the Use as default main view checkbox on the second step of the wizard, Studio will set the new main view in the jmix.ui.main-view-id application property and in the layout attribute of the @Route annotation for all existing views, for example:
@Route(value = "users", layout = MainViewTopMenu.class)
As a result, the new main view with the horizontal menu will work as expected as soon as you run the application.
DataGrid Improvements
Double-click in a data grid row now opens a detail view or, in lookup mode, finishes the selection. Desktop users will find it very convenient because they do not need to select a row and then clicking a button or menu item.
We also finished the work on the filter in column headers: it can now be reflected in URL to provide a deep link and to save the view state when navigating to a detail view and back. Use the new dataGridFilter element of the urlQueryParameters facet for this.
One more useful feature is the new gridColumnVisibility component, which enables users to hide and show grid columns:
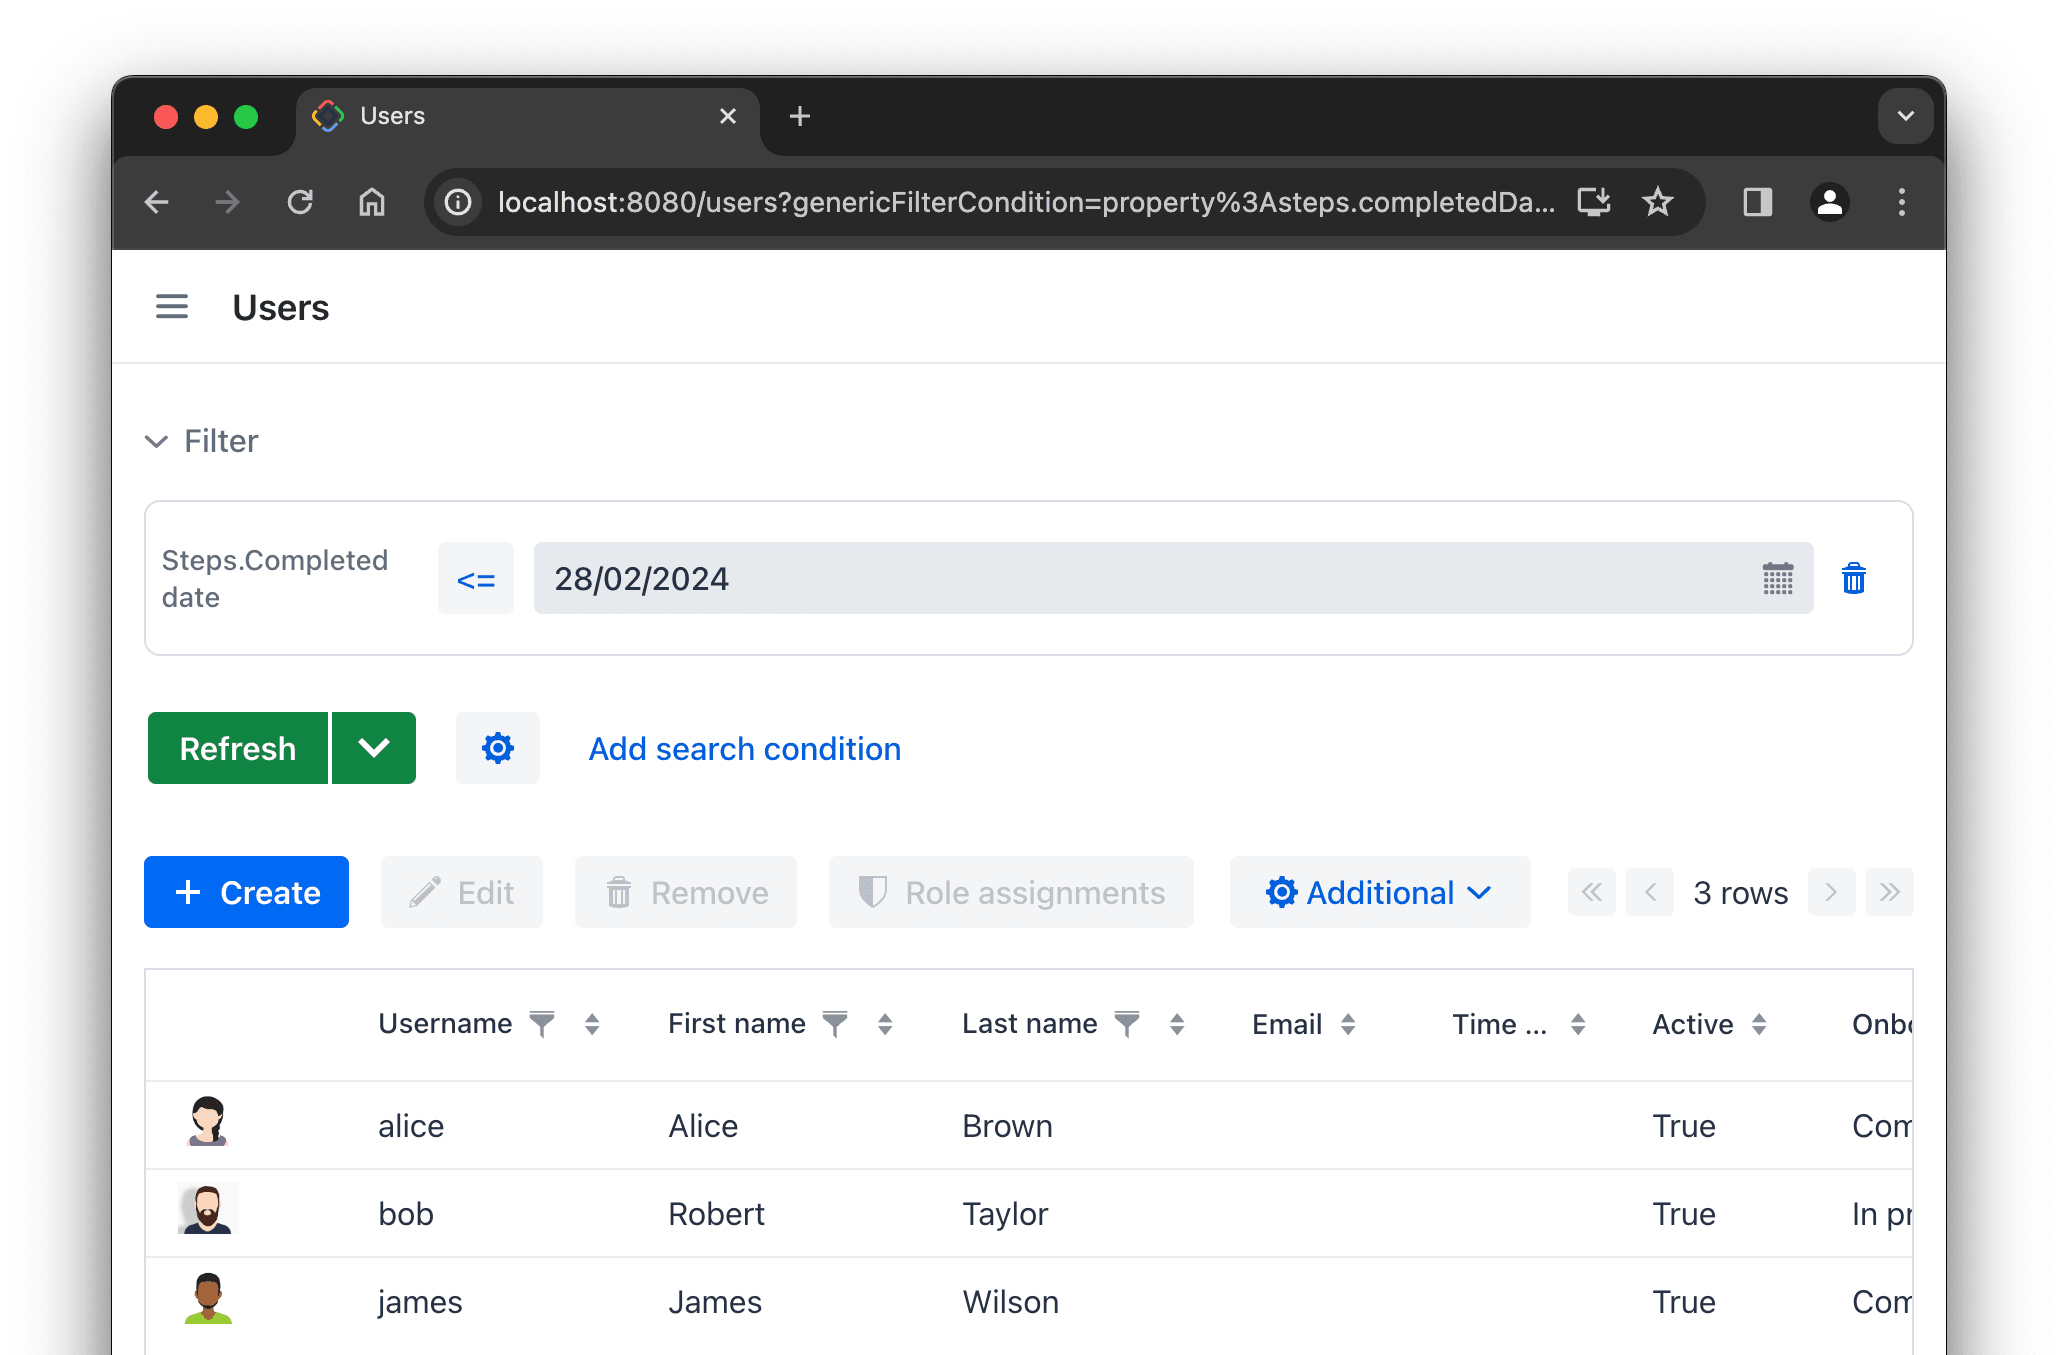
Collection Properties in Generic Filter
Previously, to filter an entity by its collection attribute using the genericFilter component, one had to define a JPQL condition with join and where clauses. Apparently, that was not something easily achievable for an end user.
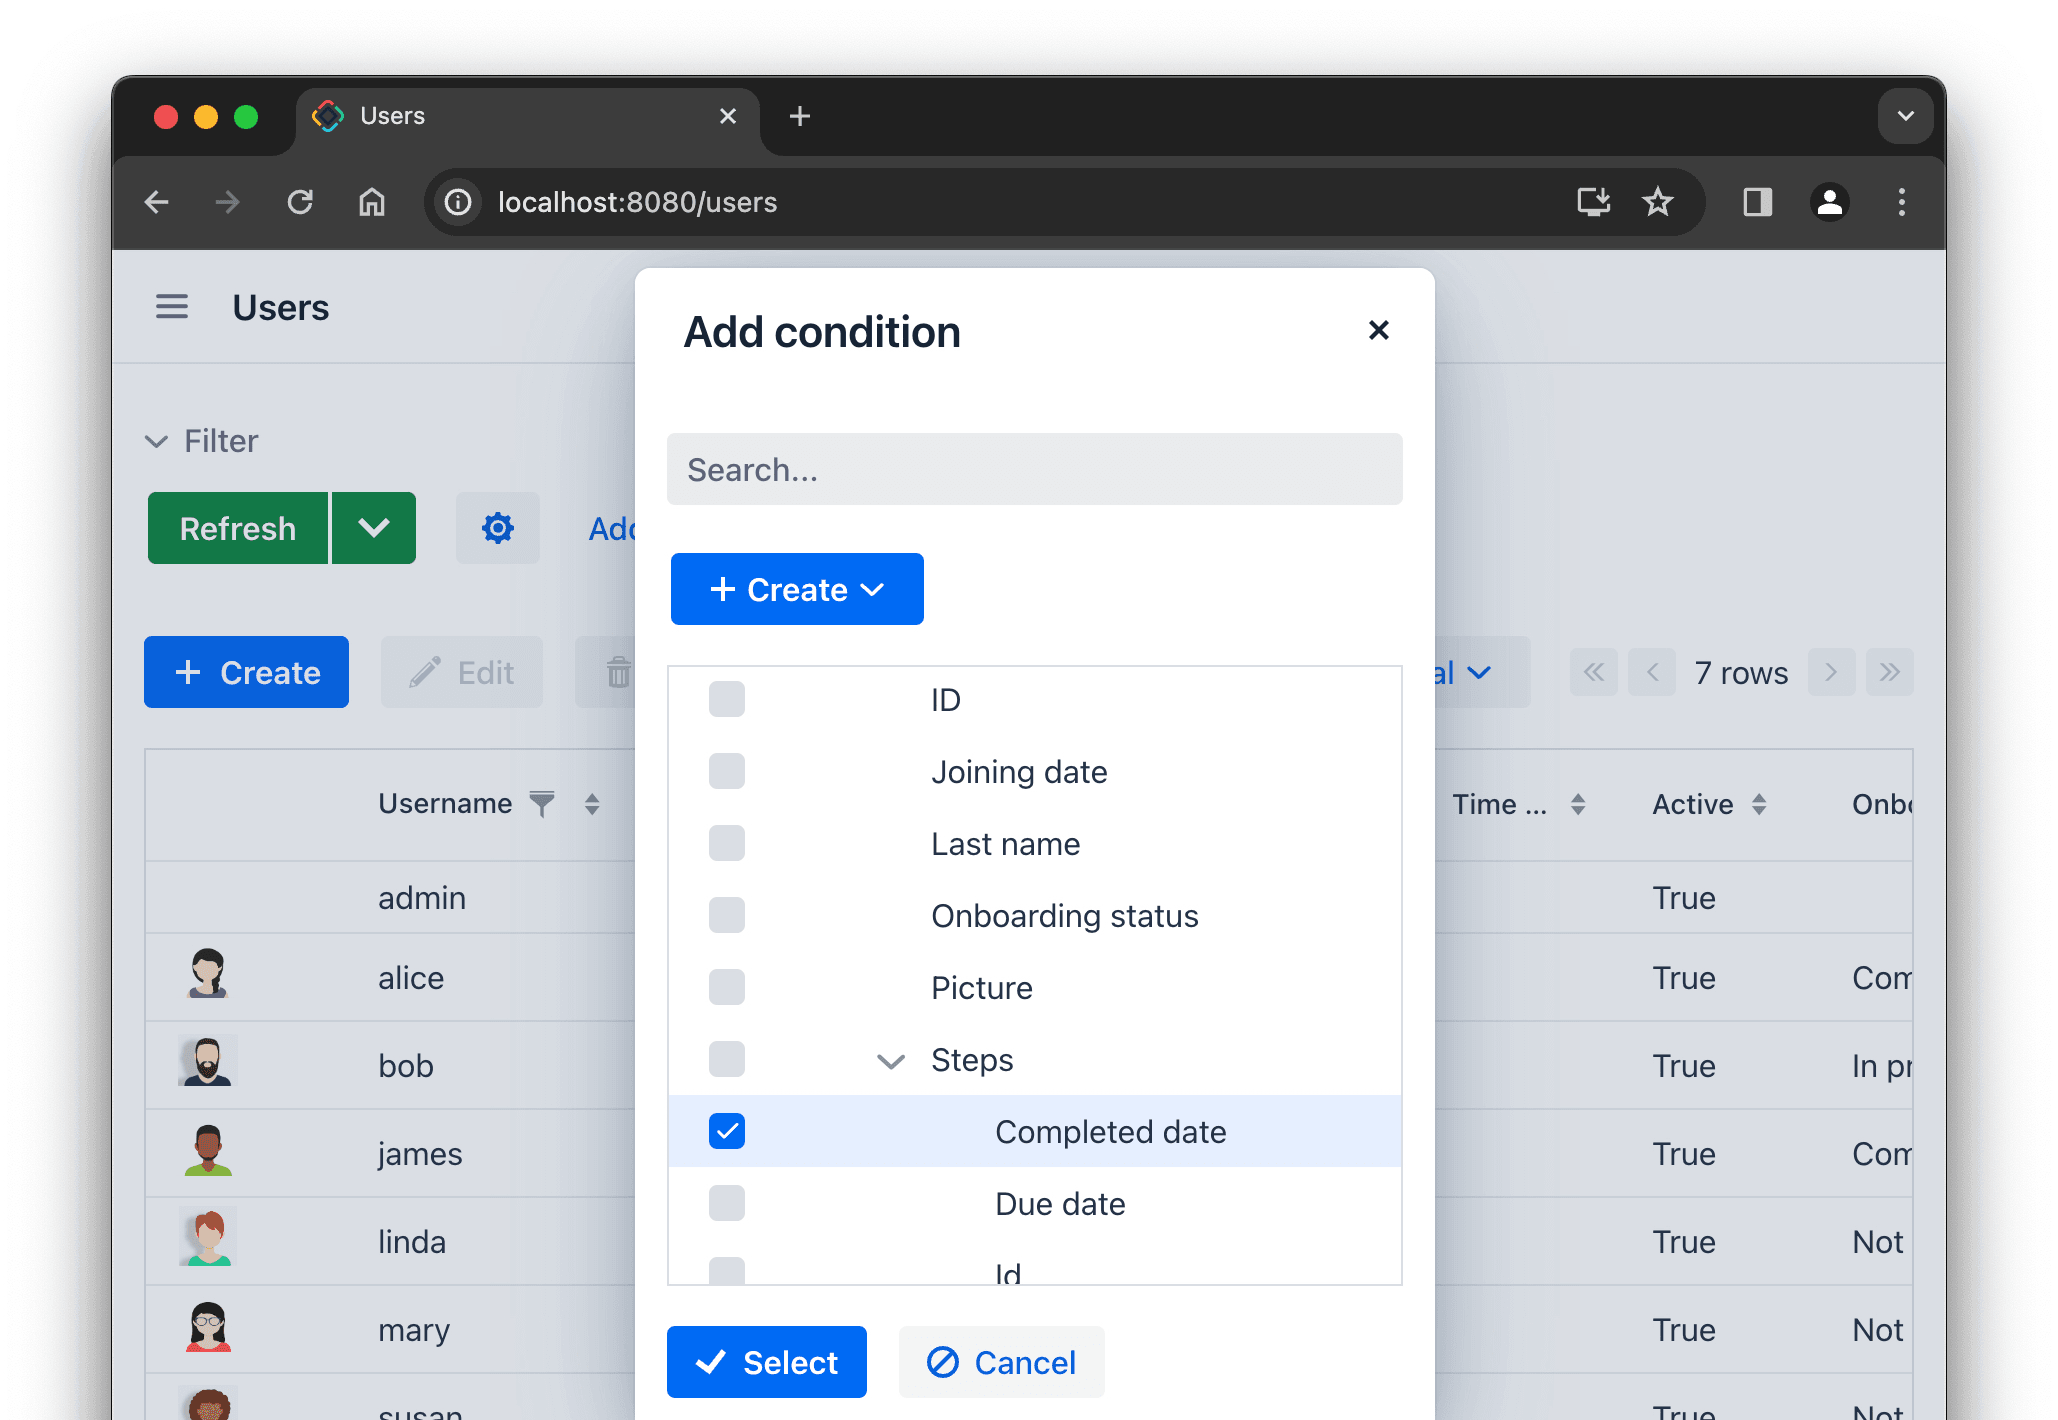
Now the filtering by to-many references and their nested attributes is as simple as with to-one references: they are shown in the Add condition dialog of the generic filter and the required JPQL conditions are generated by the framework automatically.
In the following example, the list of users is filtered by the completedDate attribute of the linked steps collection:
Reduced Build Time
While the hot deploy technology drastically shortens the feedback loop when developing the user interface, it does not apply to the development of business logic. Therefore, quick application restart during development remains crucial.
In Jmix version 2.2, the entity enhancing step, which consumes a significant amount of time during the build, will only be executed if there have been changes to the data model since the last build. Consequently, if you are working on Spring beans without modifying the entities, the build and restart process is now much faster than it was previously, especially in projects with large data models.
New Code Snippets
If you include Reports, Email sending, BPM or Notifications add-ons in your project, you will find new code snippets related to the API of these add-ons.
For example, if you want to run a report when a user clicks a button, you can generate the button click listener and then drag-and-drop the Run report using UiReportRunner snippet to the listener. Studio will prompt you to specify the report you wish to run and will generate the corresponding code for you:
The generated code just works and can be a good starting point for further customization.
Adding Components Using Wizards
As the collection of UI components expands, it becomes increasingly challenging for newcomers to locate a suitable component for a specific task.
So we decided to provide another, even more declarative way of creating UI views. Instead of selecting a component from the Add Component palette and configuring it, developers can start a wizard that prompts a series of questions. The wizard then generates an entire fragment containing preconfigured visual and data components.
In fact, the Studio included such wizards before for DataGrid and data containers, but these wizards started only when you explicitly selected the corresponding component from the palette. Now you can be unaware about existence of a particular component and just select a wizard that according to its name could accomplish your task.
In the following screencast, the Edit entity attributes wizard creates a formLayout with fields connected to a data container:
This feature is currently rather experimental and we plan to enhance it in the future by adding more wizards and making them more useful in various use cases.
Test Scaffolding
When you open a project in the new Studio, you will immediately see the Tests item in the Jmix tool window. Double-clicking on this item will take you to the Project tool window and position in the src/test/java directory.
The New → Advanced → Integration Test and UI Integration Test actions allow you to quickly generate stubs for your business logic and UI integration tests.
Free Studio for Small Projects
And the last but not least: now the premium RAD features of Studio are available for free in small projects with up to 10 entities and roles. This means that you can access all visual tools for learning, experimenting, and creating pet projects or commercial applications without needing an active commercial or trial subscription. The only limitation is that these projects should not require large data and security models.
We expect that the free tooling will make it easier for developers to learn and adopt the technology, thus making Jmix accessible to a broader audience.
What's next?
In the next feature release in June 2024, we plan to implement an integration with Apache Superset, the leading open-source data visualization platform.
On the Studio side, we are going to provide an approach for aggregating Liquibase changelogs and actions for quick conversion of similar UI components, such as entityPicker and entityComboBox.
As usual, we will dedicate a significant amount of time to fixing bugs, adding small features, and making performance improvements.
Our detailed roadmap for future releases is available as a GitHub project. Patches for the current version 2.2 will be released approximately once a month to ensure regular updates.
We appreciate your feedback on our forum, and we are thankful to all those who have submitted pull requests and shared their ideas, suggestions, and bug reports!


