Overview
Elevate your application with interactive maps and spatial data visualization. Choose your map provider and customize your map layers with ease.
Use Cases
- Visualize custom content: use an image layer to display custom images to make complex or abstract data more intuitively understood.
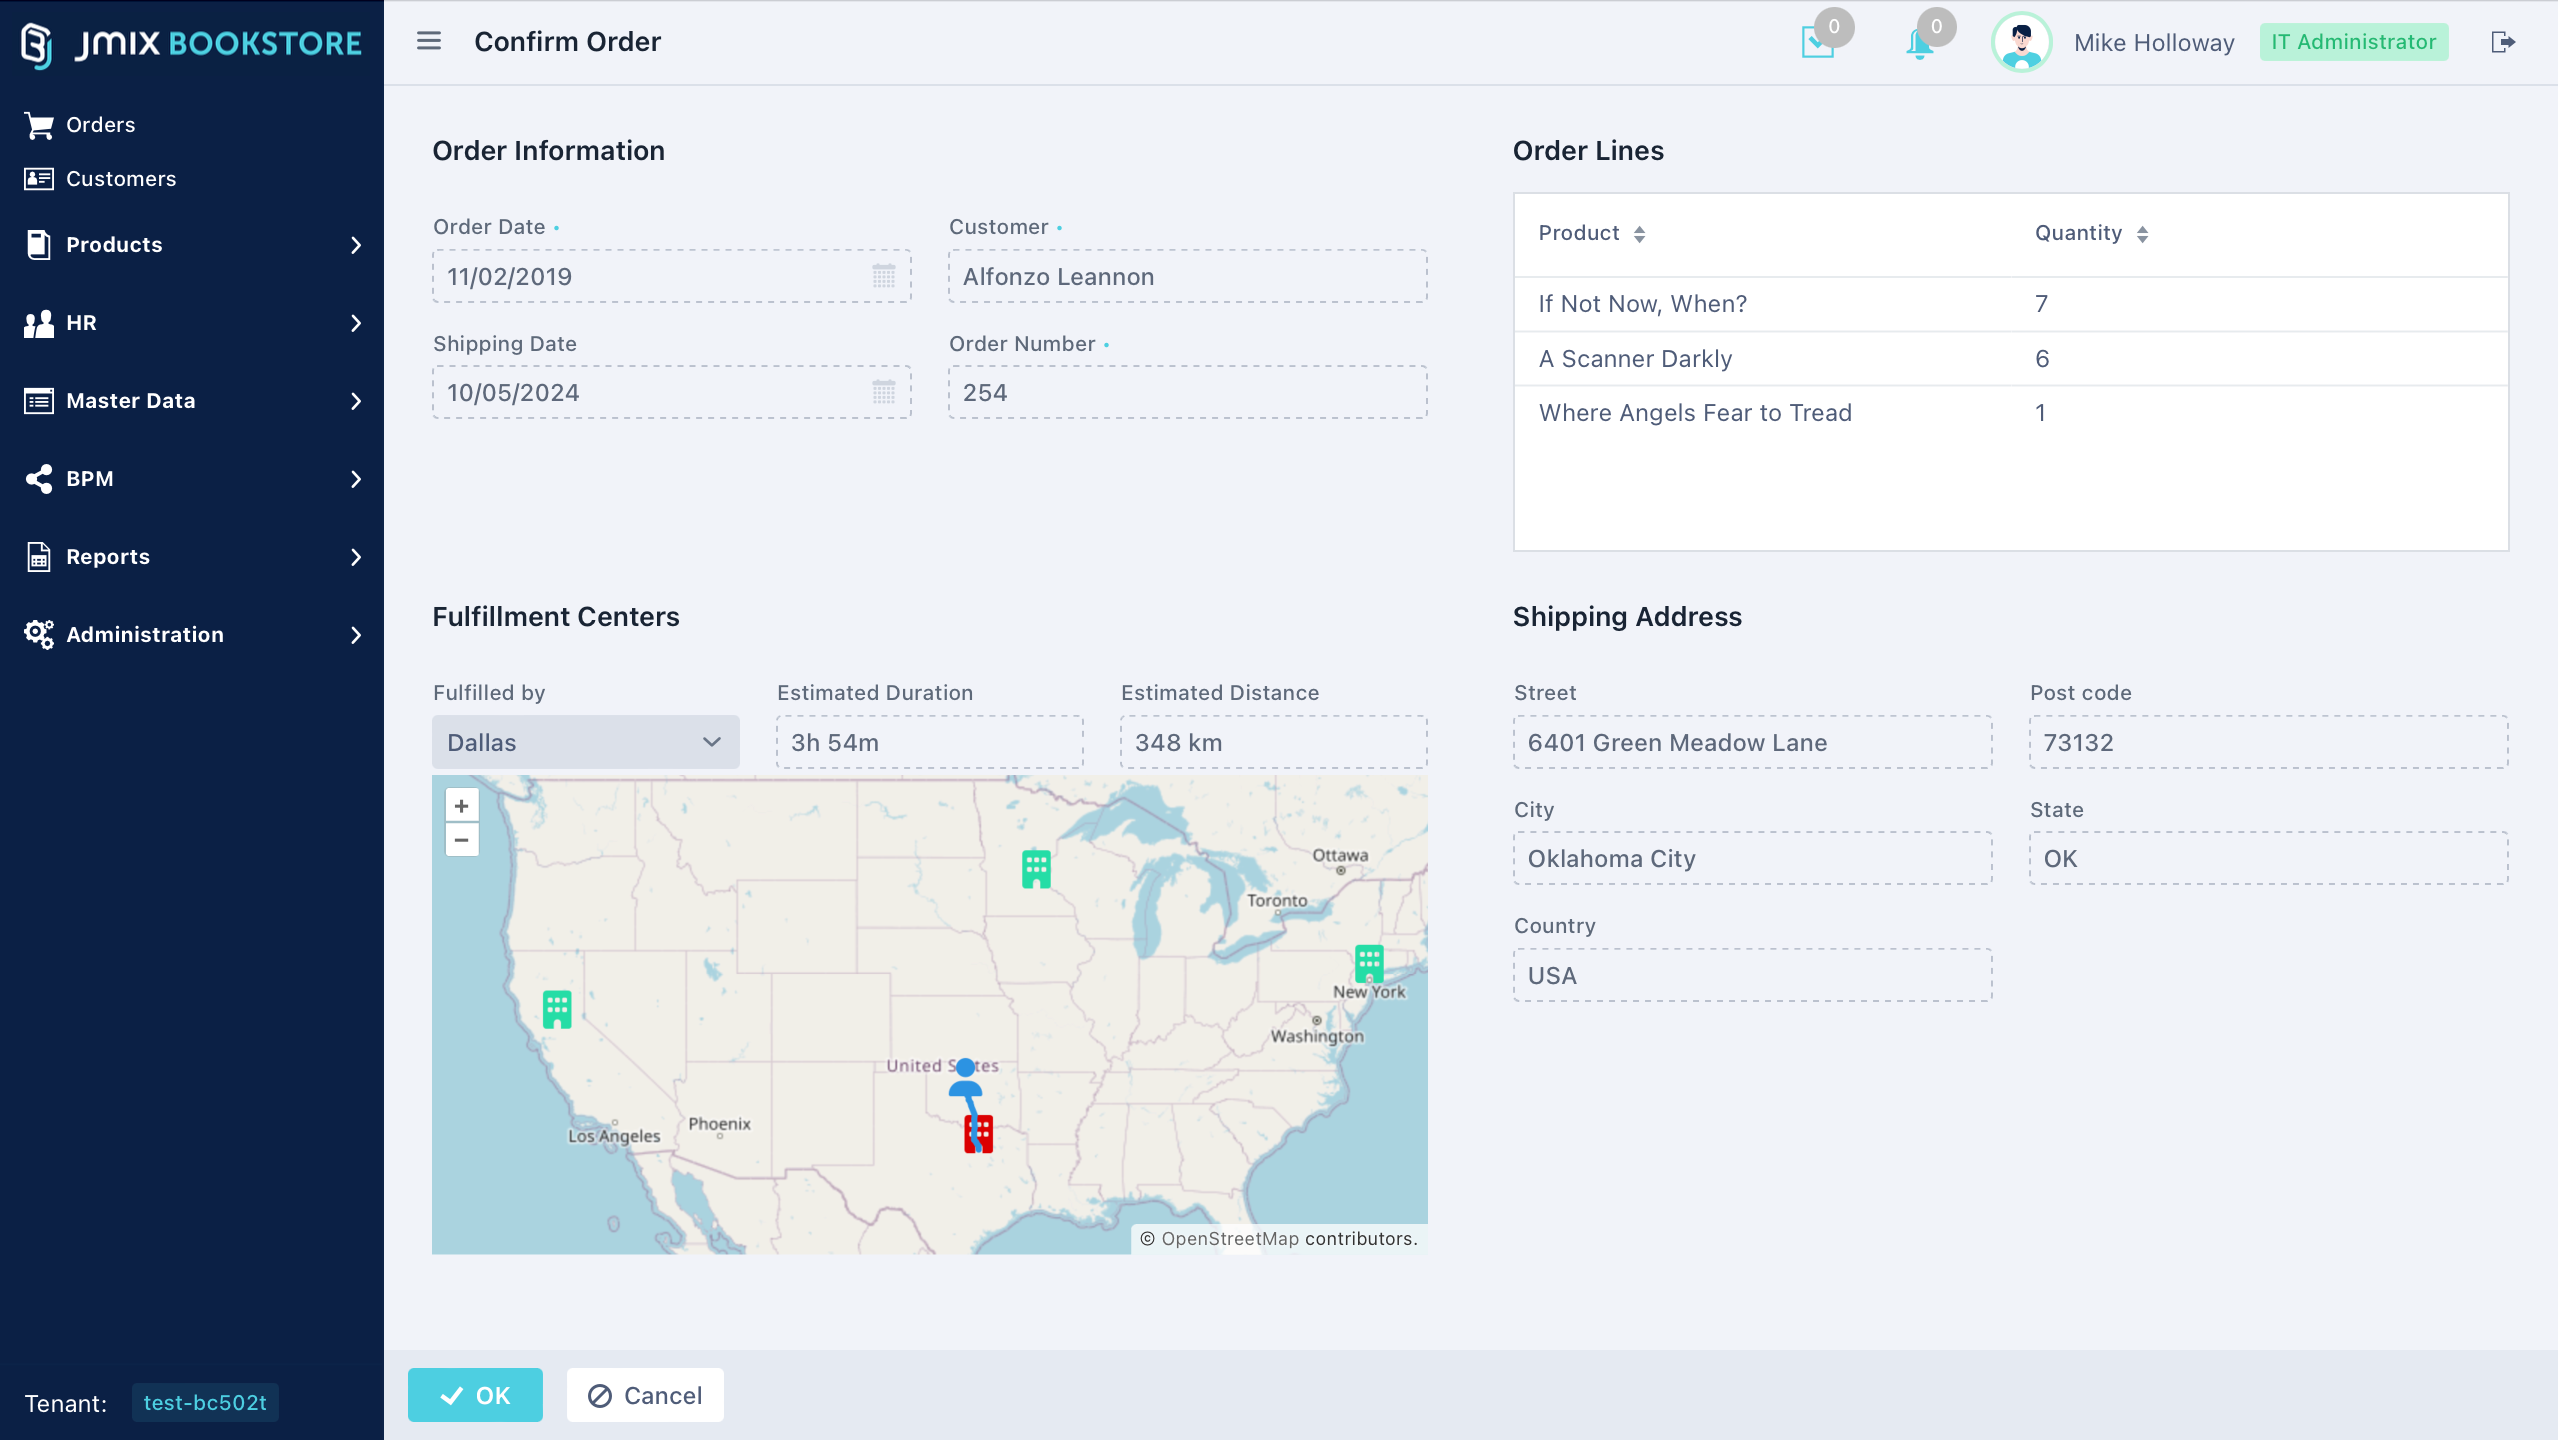
- Resource allocation and logistics: plan routes and optimize deliveries to improve resource allocation and logistics.
- Dynamic data visualization: Display real-time data like weather patterns or traffic updates in various sectors, such as transportation or urban planning.
- Contextual data visualization: Employ data binding in maps to provide context-specific information, aiding in sectors like real estate or environmental studies.
Key Features
- Multiple layer options:
o Image layer for adding specific images like floor plans or historical maps. Provides a static, fixed visual layer on your map.
o Tile layer for creating standard map views. Utilize tiled map services like XYZ or OpenStreetMap to display detailed, scalable maps.
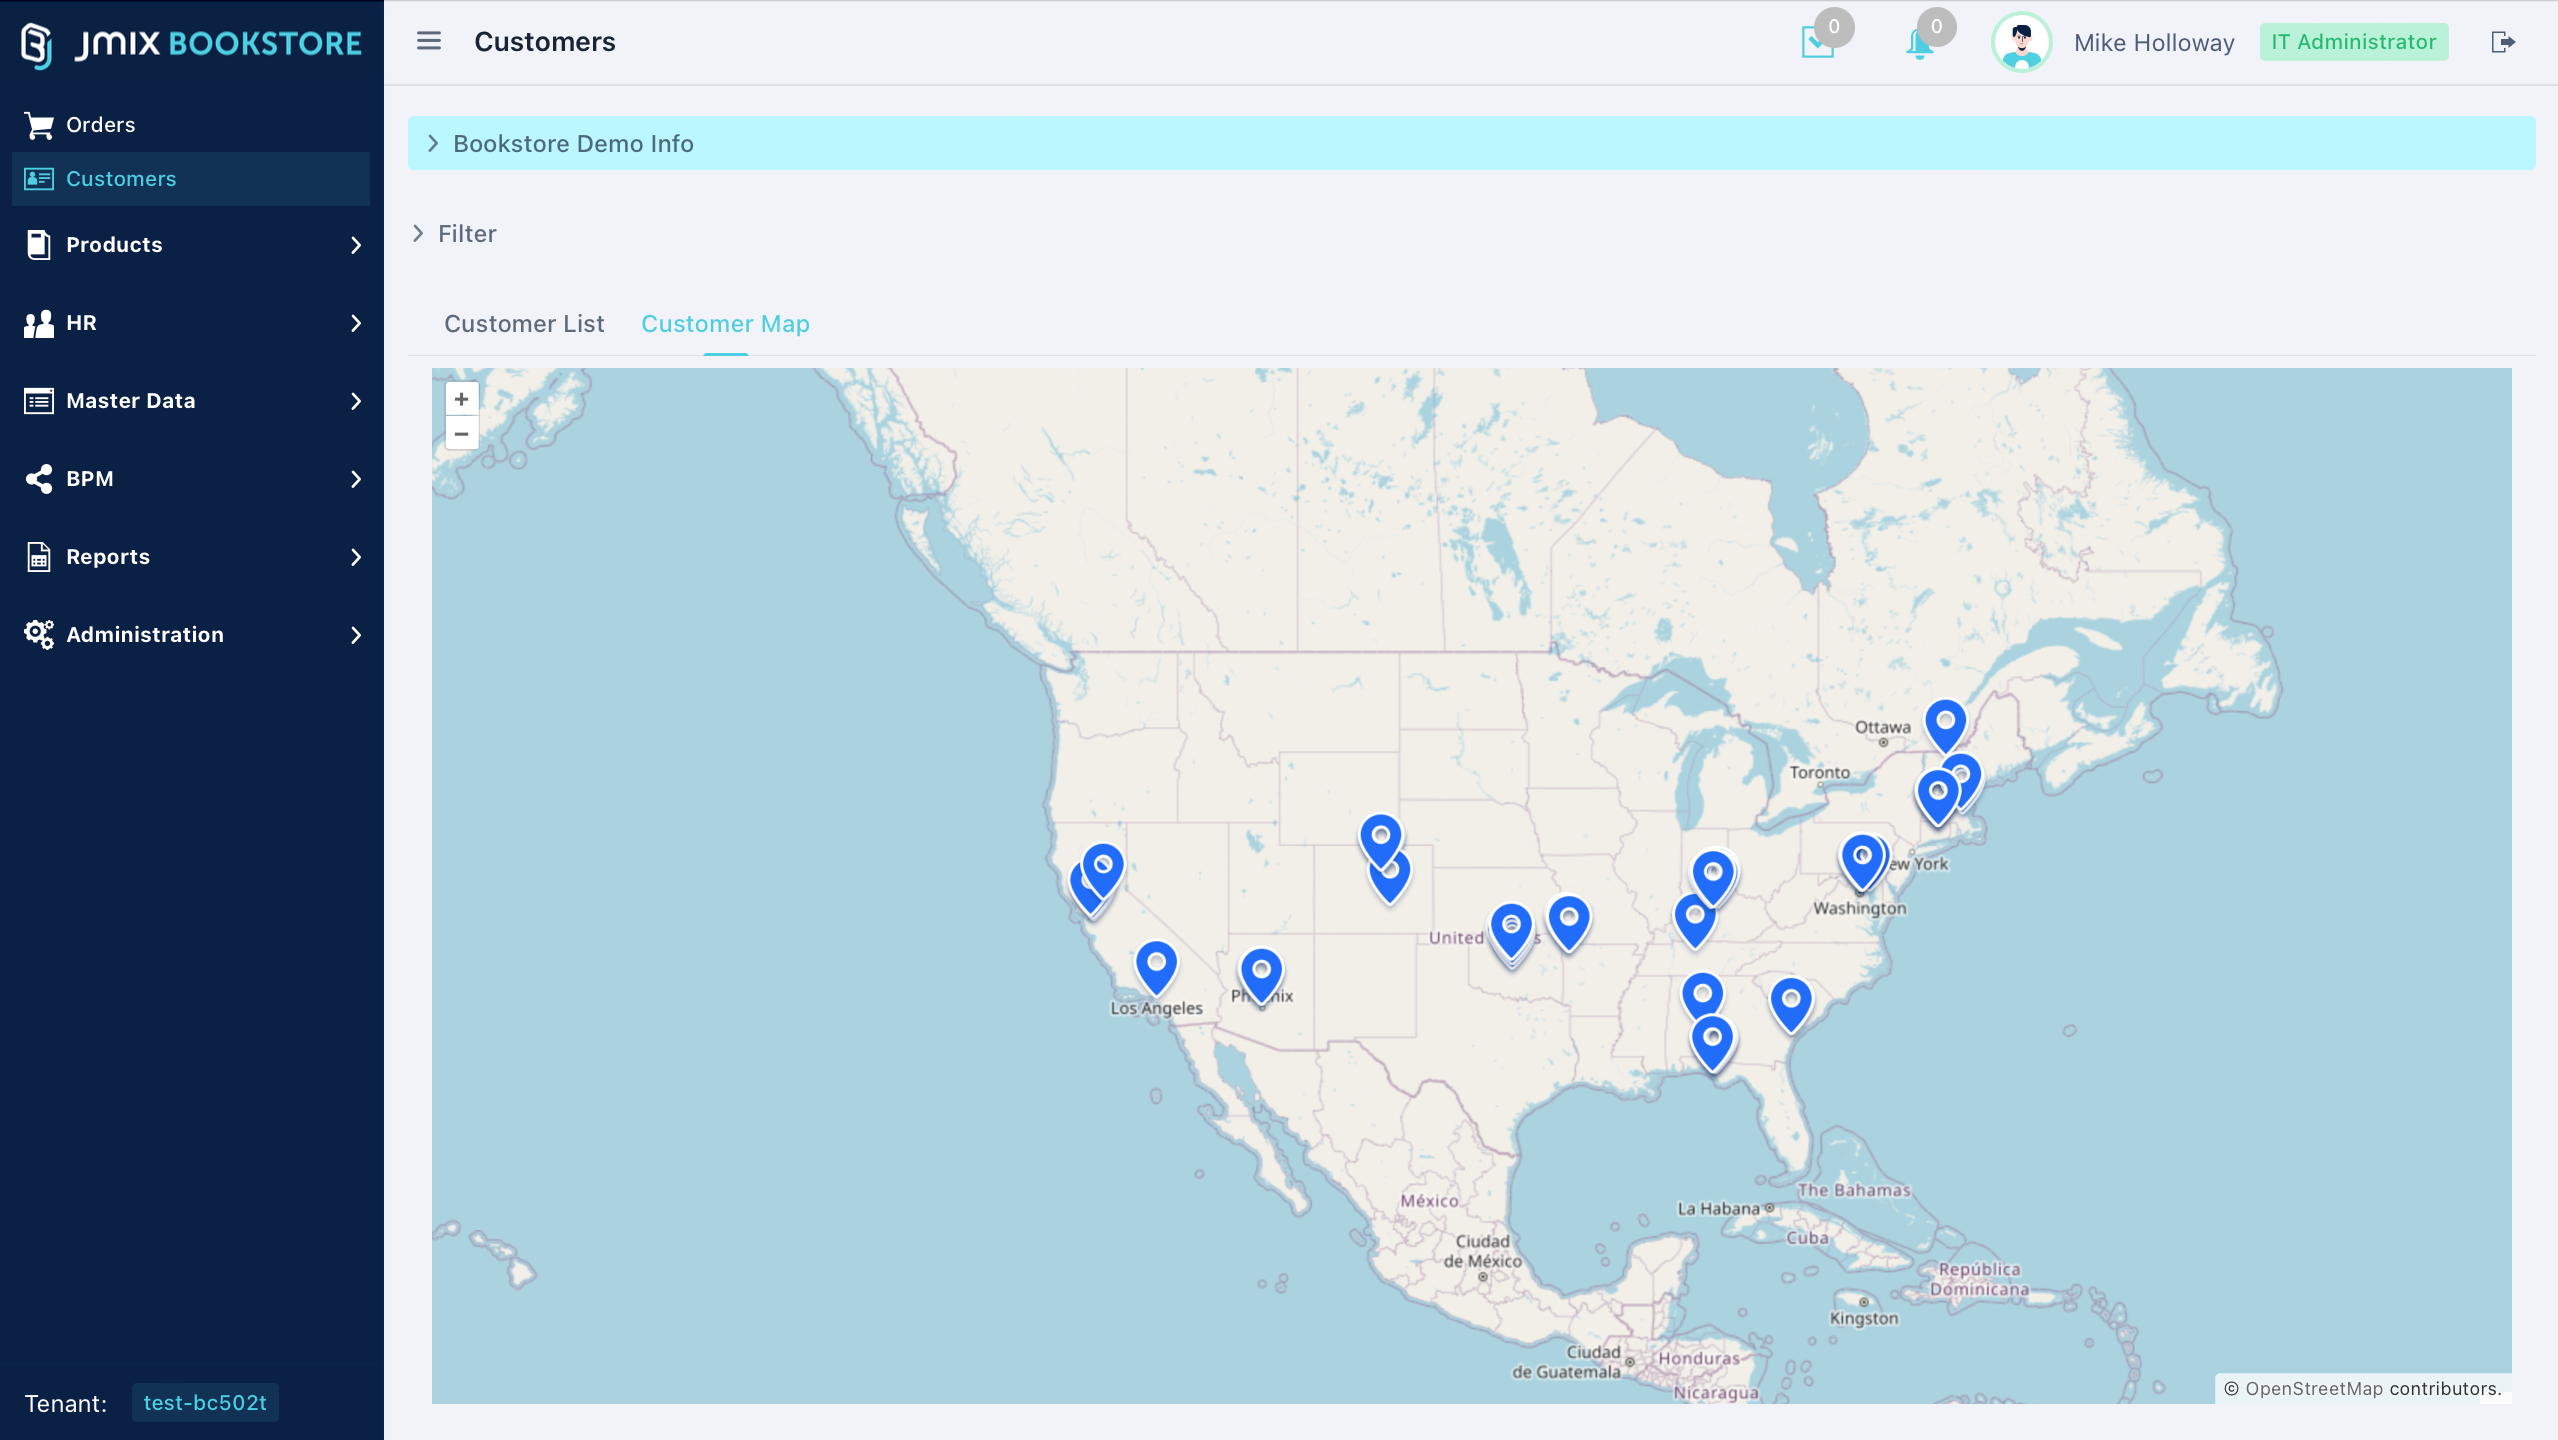
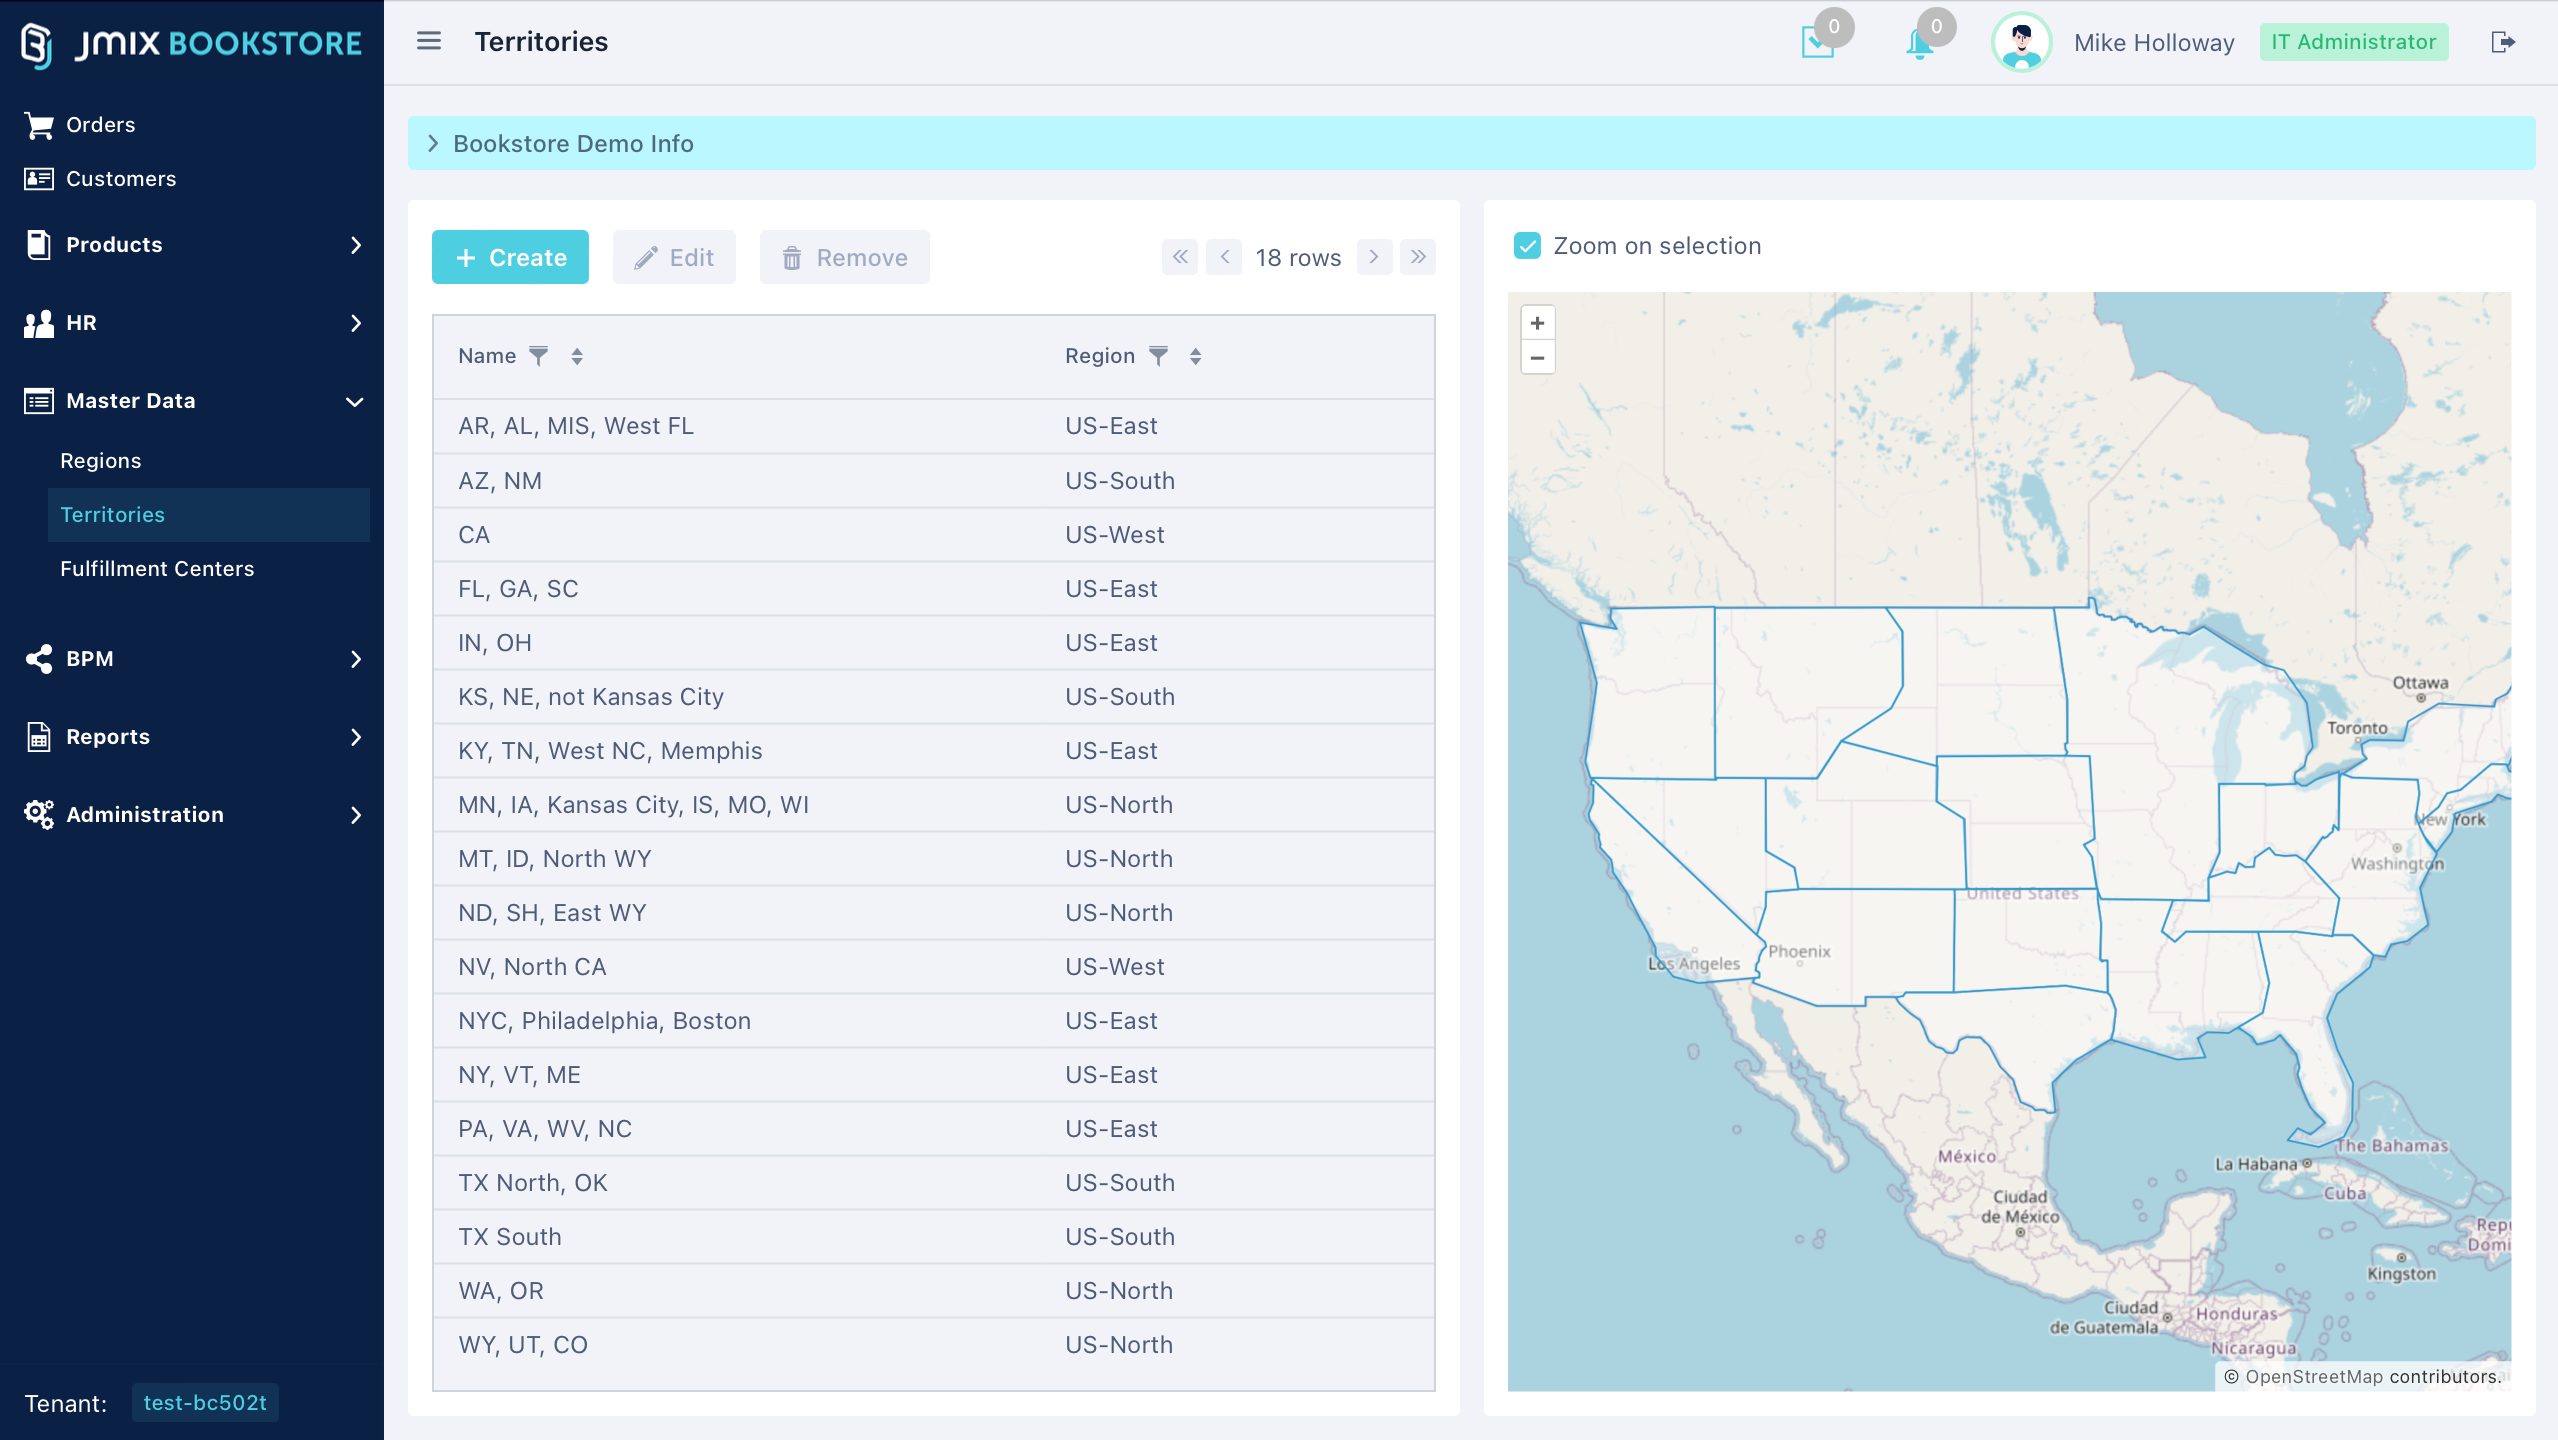
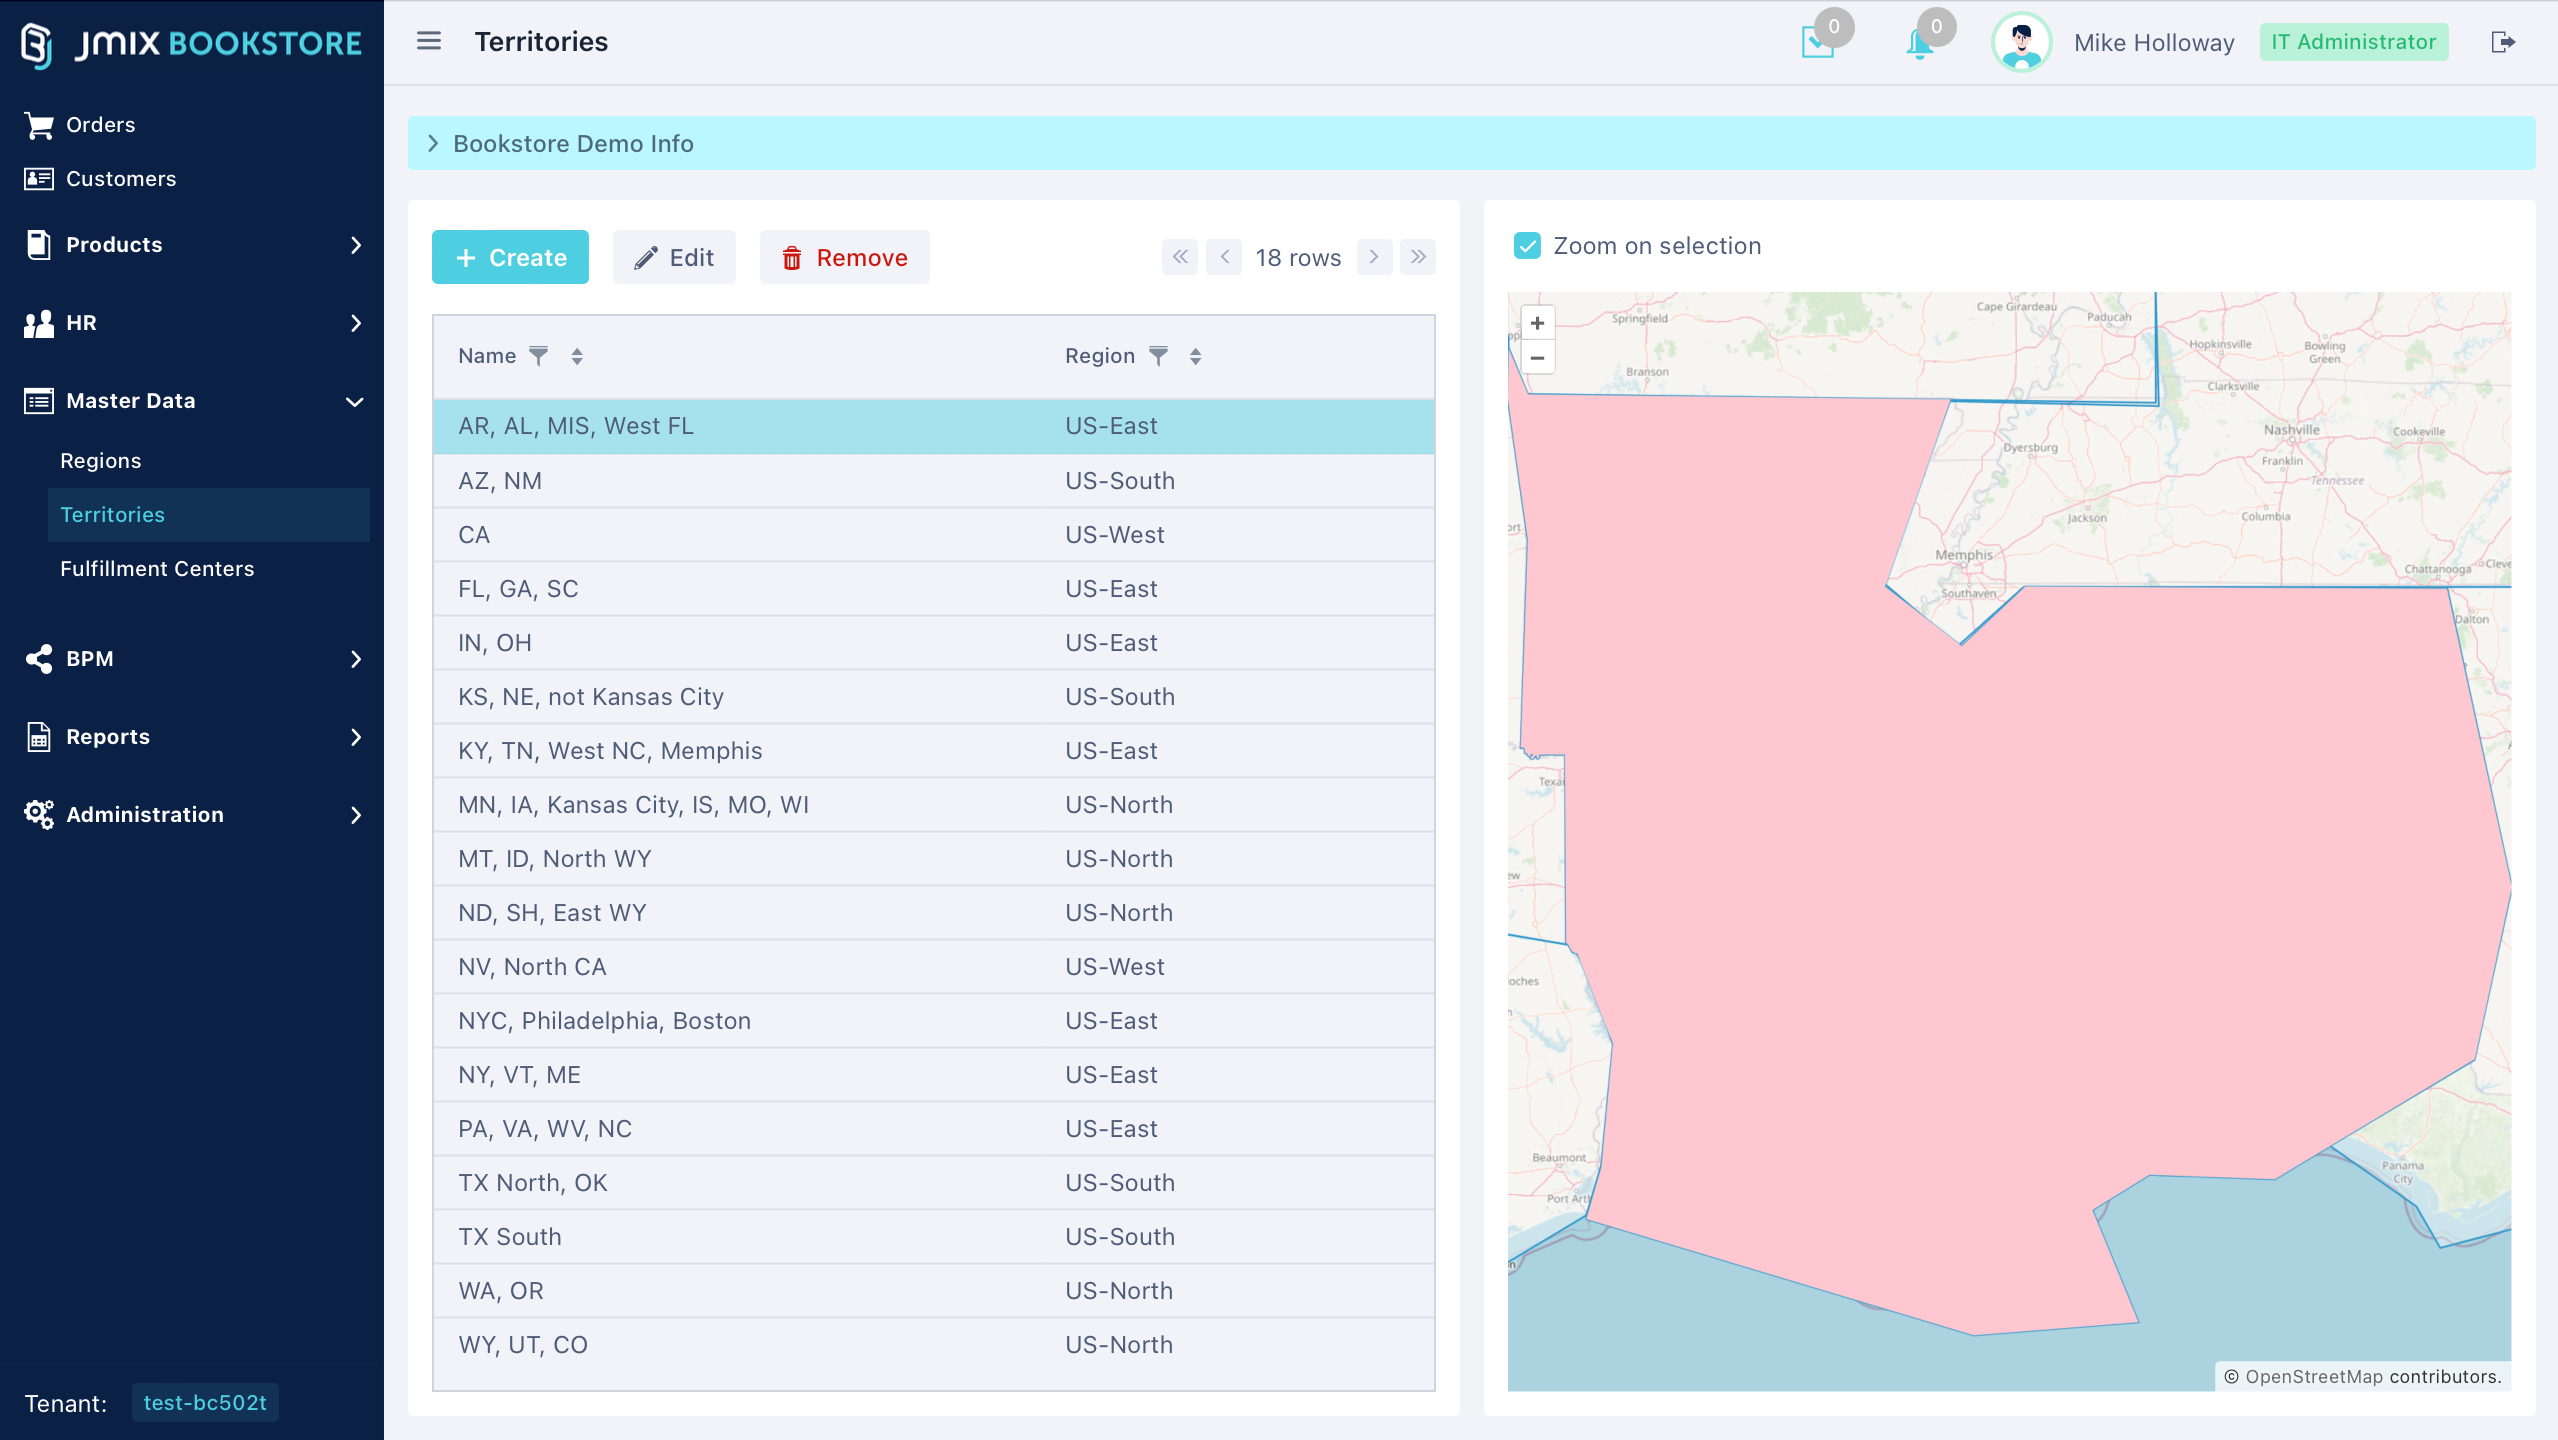
o Vector layer for displaying dynamic data or bind data from the application. Attach data vectors to shapes, lines, or points for interactive map visualizations.
- Multi-layered visualization: combine various layers in a single map for a multi-dimensional view.
To get started with the mapping solution now, install the addon.