
Once an enterprise application is released into production, it begins a life of its own. Quite often, implemented functionality is used differently from how it was originally designed—or not used at all. Business users tend to view the system from a different perspective, discovering their own paths and workarounds that can sometimes surprise the development team.
Beyond questions of how features are used, an even more fundamental concern often arises: are users using the system at all? And if they are, what does “active usage” look like at an enterprise scale?
Depending on the business case, insights like these can support strategic decisions about further investment in the system. In this article, however, we will focus on the technical side of the problem and explore active user monitoring and how it can be implemented with Jmix.
Metrics for Active Users
The metrics commonly used in enterprise applications to monitor user activity are largely the same as those used in the retail domain:
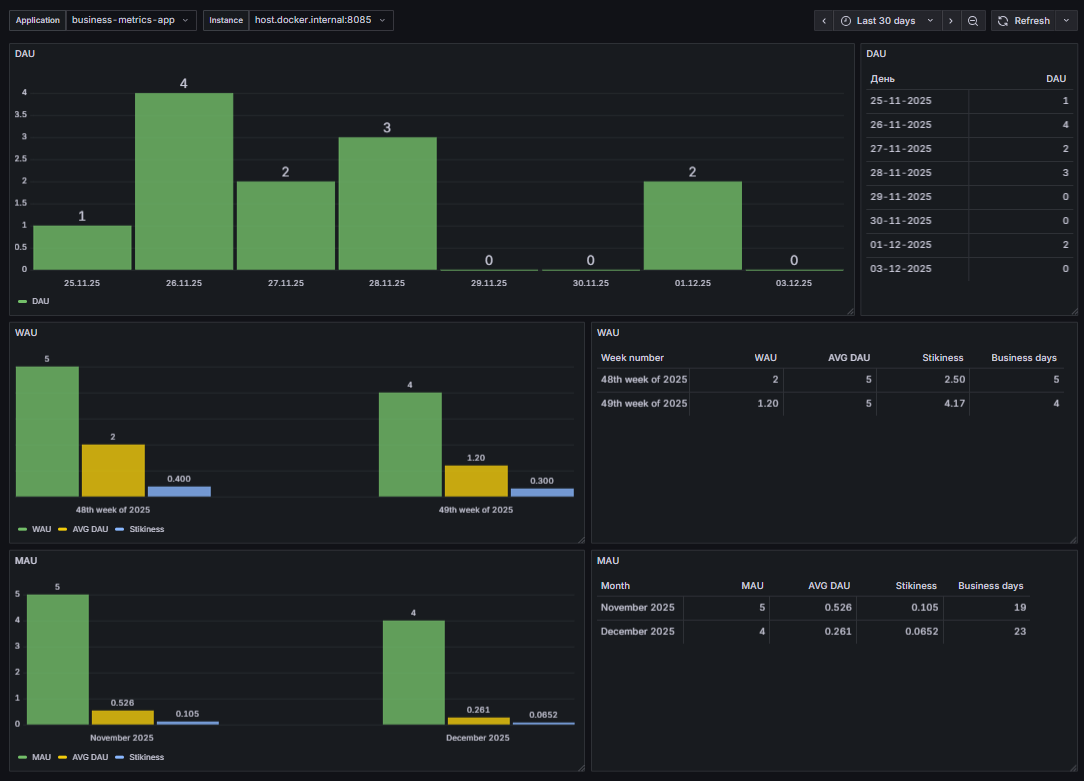
DAU (Daily Active Users)– the number of unique users who engage with the system within a 24-hour window. This window works well in enterprise environments too, especially for multinational organisations with distributed teams and flexible working hours.
WAU (Weekly Active Users)– the number of unique users who engage with the system during a week.
MAU (Monthly Active Users) – the number of unique users who engage with the system during a month.
It is important to note that WAU is not the sum of DAU values over a week, as each user is counted only once within the given period. The same applies to MAU: it is not equal to the sum of DAU or WAU values within a month.
In addition to these metrics, there is a derived indicator known as stickiness. It is calculated as the ratio of the average number of daily active users to the number of weekly or monthly active users.
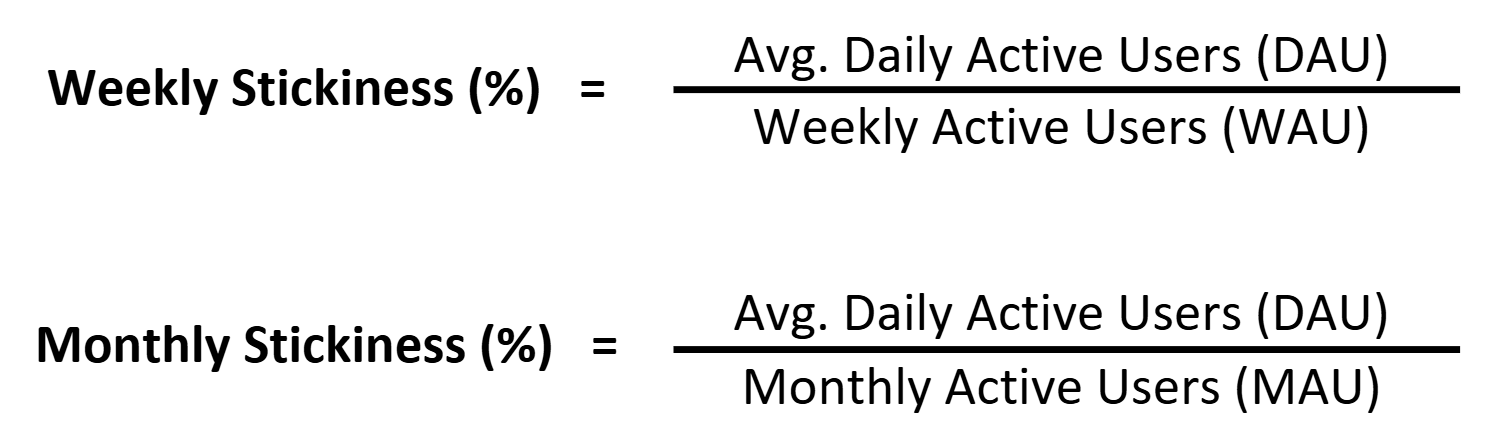
Stickiness indicates how frequently end users engage with the system. A stickiness value of 100% means that the same users are active every day, which is typically a very positive sign. At the same time, weekly or monthly stickiness can decrease even if the average number of daily active users remains stable, revealing that different users are accessing the system on different days.
The calculations above can be adjusted to better reflect specific business scenarios:
- Experiment with averaging methods. Try both the arithmetic mean and the median to account for strong deviations or skewed distributions.
- Refine the definition of an “active user”. Clearly define which actions contribute to activity, such as viewing or editing documents, generating reports, tracking time, or even the number of clicks.
- Consider the working calendar. While a 24-hour window is suitable for DAU, the number of working days in a week or month still affects WAU and MAU. In Jmix applications, this can be addressed using the Jmix Business Calendar, which supports working shifts, public holidays, and weekends.
As you might expect, all these metrics can be applied not only to the system as a whole, but also to specific features or functional areas.
Collecting metrics with Jmix
Let’s assume that, after proper business analysis, we have identified which system actions should be tracked. The next step is the technical implementation of business metrics such as DAU, WAU, MAU, and the corresponding stickiness indicators. How can Jmix help with this?
In Jmix, application metrics are collected, exposed, and exported using the Micrometer library. Micrometer is part of Jmix’s observability and monitoring support and is the de facto metrics facade in the Java and Spring ecosystem. In practice, it provides a standard, vendor-neutral way to turn low-level application metrics into meaningful business insights.
Jmix integrates Micrometer on top of Spring Boot Actuator, a Spring Boot module that offers production-ready features for monitoring and managing applications at runtime. This integration provides several benefits:
- Automatic metrics for core Jmix components
- Simple configuration through application.properties
- Compatibility with Spring Boot’s built-in monitoring endpoints and metrics
- Flexible configuring with the standard Spring mechanisms
Out of the box, Jmix includes built-in metrics for its main structural units—Views and Data Loaders. This means that when you create screens and implement data-handling logic, you automatically gain the ability to monitor their behaviour without additional configuration.
Supported lifecycle stages for Views include:
Create, Load, Init, Before Show, Ready, Inject, Before Close, After Close.
Supported lifecycle stages for Data Loaders include:
Pre-load, Load, Post-load.
Additional metrics can be introduced as needed by using the Micrometer API directly, for example by incrementing counters within event listeners that correspond to specific user actions.
We plan to publish more technical articles that provide step-by-step guidance on configuring application metrics and the supporting monitoring infrastructure. In the meantime, you can explore the example below and consult the Jmix AI Assistant, which is always ready to help with technical questions.
Metrics visualization
Once application metrics are available, they can be exposed to monitoring tools immediately. While it is possible to build internal monitoring dashboards in Jmix using the Charts add-on, the more common approach is to rely on established observability tooling.
A typical setup uses Prometheus for external metric collection and storage, and Grafana for visualisation. Both tools integrate seamlessly with Micrometer through Spring Boot Actuator, making them a natural choice for production environments.
Jmix also provides ready-made Grafana dashboards for Jmix specifically designed for visualising application metrics. As a result, there is usually no need to introduce custom visualisation logic into the application itself. Instead, you can rely on existing infrastructure and well-established practices to analyse statistical and performance data.
As mentioned earlier, Views and Data Loaders are available for monitoring out of the box. In Prometheus, these metrics are exposed using the following prefixes:
- 'jmix_ui_views' — supported tags: 'lifeCycle', 'view'
- 'jmix_ui_data' — supported tags: 'lifeCycle', 'view', 'dataLoader'
These metrics can be used directly in Prometheus queries and Grafana dashboards to gain detailed insights into user interaction patterns and application behaviour. For example:
jmix_ui_data_seconds_max{dataLoader="usersDl",lifeCycle="load",view="User.list",} 0.005668899
Metrics implementation for Active User Monitoring
Now let’s return to the business metrics introduced at the beginning of this article. To demonstrate how they can be implemented in practice, we have prepared a sample application whose purpose is to register active users and calculate the corresponding metrics for Prometheus.
Alongside the application source code, you will find several useful artefacts:
- A README file that provides a detailed explanation of the implementation
- Step-by-step instructions showing how to integrate these metrics into your own project
- A ready-to-import Grafana dashboard, as well as a docker-compose file for quickly setting up the monitoring infrastructure
For the sake of simplicity, this example assumes that a user is considered active as soon as they successfully log in to the system. To implement this logic, we rely on two Jmix add-ons: Quartz and Jmix Business Calendar.
Our intermediate goal is to teach the application to expose metrics in the following format:
#HELP active_users_dau The daily active users metric
#TYPE active_users_dau gauge
active_users_dau{application="business-metrics-app"} 2.0
#HELP active_users_mau The monthly active users metrics
#TYPE active_users_mau gauge
active_users_mau{application="business-metrics-app", subtype="avg_dau"} 0.42105263471603394 active_users_mau{application="business-metrics-app", subtype="days_count"} 19.0 active_users_mau{application="business-metrics-app", subtype="main_value"} 4.0
#HELP active_users_wau The weekly active users metrics
#TYPE active_users_wau gauge
active_users_wau{application="business-metrics-app", subtype="avg_dau"} 1.600000023841858 active_users_wau{application="business-metrics-app", subtype="days_count"} 5.0 active_users_wau{application="business-metrics-app", subtype="main_value"} 4.0
As shown above, the exported metrics include:
- DAU, WAU, and MAU values
- Average DAU (metrics labelled subtype="avg_dau")
- The number of actual working days in the period (metrics labelled subtype="days_count")
As you may know, PromQL is the primary query language used to retrieve and manipulate data for visualisations in Grafana. However, despite the apparent simplicity of the task, PromQL alone is not sufficient in this case for several reasons:
- The active_users_dau metric is not a regular gauge. We are not interested in how DAU changes throughout the day; only the final daily value matters.
- Time data must be properly formatted and aligned to allow aggregation by day.
- Displaying active_users_wau, active_users_mau, average DAU, and stickiness on the same chart is not straightforward using PromQL alone.
In our example, these challenges are addressed using Grafana’s powerful Transformations mechanism. Transformations allow data to be reshaped into a form that best suits a specific visualisation without modifying the original data in the data source and without impacting the data source performance. This significantly extends the practical capabilities of PromQL and enables more advanced dashboards with minimal additional complexity.
Result
In summary, we implemented a practical and flexible approach to analysing enterprise application usage, combining configurable working calendars with the powerful visualisation capabilities of Grafana.
By building on standard monitoring tools such as Prometheus and Grafana, we achieved an effective solution for tracking usage efficiency in Jmix-based applications without adding unnecessary complexity.
Key benefits:
- Business-relevant metrics such as DAU, WAU, MAU, and stickiness derived from real user activity
- Flexible calendar awareness, including working days, holidays, and shifts
- Minimal application overhead by relying on Micrometer, Prometheus, and Grafana
- Rich visualisation and analysis using ready-made dashboards and Grafana transformations
- Scalable and extensible architecture based on industry-standard tooling
This approach provides a solid foundation for understanding how enterprise systems are actually used and for making informed technical and business decisions.